
Introduction to Differentiation: Exploring Tangent Slopes Dynamically
Loading the math board and drawing, please wait…
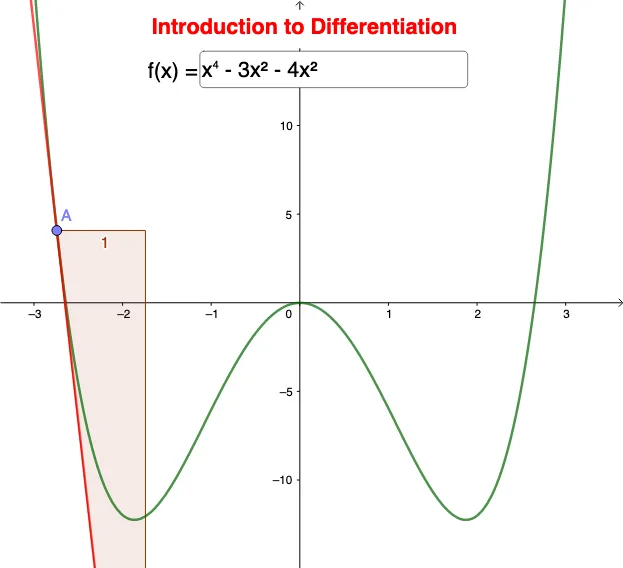
① This interactive GeoGebra example visually demonstrates the geometric meaning of the derivative (tangent slope) at a point on a function, allowing users to drag a point or input values to observe how the slope changes. ② Core mathematical concepts include the definition of the derivative, tangent line slope, local rate of change, and the integration of piecewise functions, hyperbolas, and polygons. ③ Construction highlights: uses GeoGebra commands such as Point to create movable point A, Tangent to draw the tangent line, Slope to compute its slope, CurveCartesian for custom curves, Textfield and InputBox1 for numeric input, and text1 to display the slope value; objects f, g, h, m, a represent functions, auxiliary lines, slope values, etc. ④ Suitable for high school to early college students beginning calculus, this example aids in understanding the intuitive background of derivatives and serves as a classroom demonstration tool bridging geometric intuition and algebraic definitions.
GeoGebra Commands & Parameters
Point(f) → ATextfield(f) → InputBox1Tangent(A, f) → hSlope(h) → mCurveCartesian((a, g(a)), a, -5, x(A)) → a
AI Drawing Prompt Reference
Draw a function graph with a draggable point, and sketch the tangent line at this point while displaying its slope value. Include an input box for entering the function expression and a slider to control parameters. Also, incorporate various auxiliary shapes like piecewise functions, hyperbolas, and polygons to illustrate how the tangent slopes change across different functions.
The prompt above was compiled from the original drawing commands and is for reference only.