
Play Notes
Loading the math board and drawing, please wait…
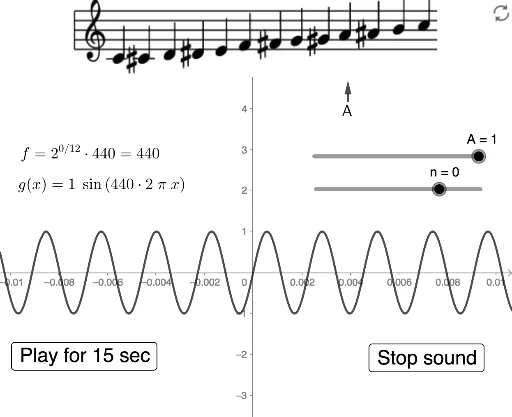
This example dynamically demonstrates the process of playing notes using GeoGebra. It involves the concept of function graphing and slider animation. By using commands like Text and Vector, users can observe the frequency changes of notes. This example is suitable for high school mathematics teaching, especially for teaching function graphs and dynamic geometry.
GeoGebra Commands & Parameters
Text(B1, A1, false, true) → C1Text(B2, A2, false, true) → C2Text(B3, A3, false, true) → C3Text(B4, A4, false, true) → C4Text(B5, A5, false, true) → C5Text(B6, A6, false, true) → C6Text(B7, A7, false, true) → C7Text(B8, A8, false, true) → C8Text(B9, A9, false, true) → C9Text(B10, A10, false, true) → C10Text(B11, A11, false, true) → C11Text(B12, A12, false, true) → C12Text(B13, A13, false, true) → C13Vector(E1, F1) → G1Vector(E2, F2) → G2Vector(E3, F3) → G3Vector(E4, F4) → G4Vector(E5, F5) → G5Vector(E6, F6) → G6Vector(E7, F7) → G7Vector(E8, F8) → G8Vector(E9, F9) → G9Vector(E10, F10) → G10Vector(E11, F11) → G11Vector(E12, F12) → G12Vector(E13, F13) → G13
AI Drawing Prompt Reference
Create a dynamic note display with multiple text labels and vectors. Start by drawing text labels to describe the frequency changes of different notes, then draw vectors to represent the waveforms of the notes.
The prompt above was compiled from the original drawing commands and is for reference only.