
Percentage of the Part
Loading the math board and drawing, please wait…
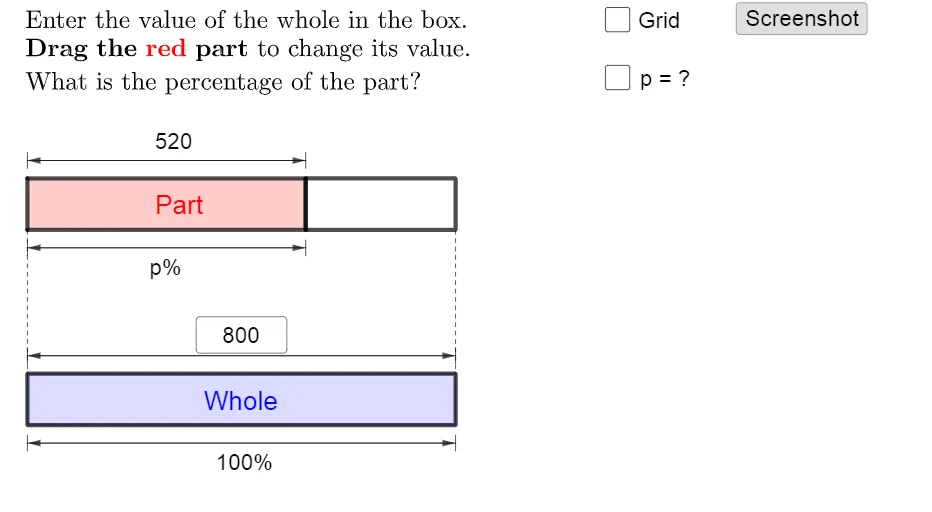
This example demonstrates how to dynamically calculate and visualize the percentage of a part relative to a whole using GeoGebra. Key math concepts include percentage calculations, algebra, and coordinate geometry. Construction highlights involve commands like Point, If, Polygon, Sequence, Textfield, Segment, Vector, and objects such as A, B, P0, Q, q1, q2 for interactive geometry and text display. Suitable for middle school and above, illustrating the application of percentages, functions, and geometry.
GeoGebra Commands & Parameters
Point(yAxis) → APoint(yAxis) → BIf(x(P) ≤ 10, P, (x(P), y(B))) → P0If(x(P) ≤ 10, A + (10, 0), B + (10, 0)) → A0Polygon({P0, A0, A0 + (0, 1), P0 + (0, 1)}) → q2Polygon(P, Q, (0, y(Q)), (0, y(P))) → q1, p_1, q, g, hPolygon({B, B + (10, 0), B + (10, 1), B + (0, 1)}) → q3Polygon({B, B + (10, 0), B + (10, 1), B + (0, 1)}) → q4Sequence(Segment[B + (i, 0), B + (i, 1)], i, 1, 9, 1) → l1Sequence(Sequence[Segment[B + (j + i, 0), B + (j + i, 1)], j, 0, 9, 1], i, 0.1, 0.9, 0.1) → l2Sequence(Segment[A + (i, 0), A + (i, 1)], i, 1, 9, 1) → l3Sequence(Sequence[Segment[A + (j + i, 0), A + (j + i, 1)], j, 0, 9, 1], i, 0.1, 0.9, 0.1) → l4Textfield(n) → InputBox1Textfield(m) → InputBox2If(a, "p", (p * "")) → ptextIf(b, "m", (m * "")) → mtextIf(c, "n", (n * "")) → ntextSegment(A + (0, 1.2), A + (0, 1.5)) → iSegment(P + (0, 1.2), P + (0, 1.5)) → jVector(Midpoint[i], Midpoint[j]) → uVector(Midpoint[j], Midpoint[i]) → vSegment(A - (0, 0.2), A - (0, 0.5)) → kSegment(P - (0, 0.2), P - (0, 0.5)) → lVector(Midpoint[k], Midpoint[l]) → wVector(Midpoint[l], Midpoint[k]) → eSegment(B + (0, 1.2), B + (0, 1.5)) → fSegment(B + (10, 1.2), B + (10, 1.5)) → rVector(Midpoint[f], Midpoint[r]) → sVector(Midpoint[r], Midpoint[f]) → tSegment(B - (0, 0.2), B - (0, 0.5)) → f_1Segment(B + (10, -0.2), B + (10, -0.5)) → g_1Vector(Midpoint[f_1], Midpoint[g_1]) → u_1Vector(Midpoint[g_1], Midpoint[f_1]) → v_1If(a, "p", If[b, "m", "n"]) → text12Sequence(Segment[A + (10 + i, 0), A + (10 + i, 1)], i, 0.1, x(P) - 10, 0.1) → l6Sequence(Segment[A + (10 + i, 0), A + (10 + i, 1)], i, 0, floor(x(P) - 10)) → l5Segment(A, B + (0, 1)) → h_1Segment(If[x(P) ≤ 10, A + (10, 0), P], If[x(P) ≤ 10, B + (10, 1), x(P)]) → i_1Sequence(Segment[A0 + (i, 0), A0 + (i, 1)], i, 0, floor(x(P0) - 10)) → l7Sequence(Segment[A0 + (i, 0), A0 + (i, 1)], i, 0.1, x(P0) - 10, 0.1) → l8
AI Drawing Prompt Reference
On a coordinate plane, place two points on the y-axis as upper and lower references, and a draggable point. If its x-coordinate is at most 10, keep it; otherwise, clamp it to the upper reference's horizontal line. Form a rectangle using this point, a fixed point, and the y-axis. Draw a 10-by-1 rectangle at the upper reference, subdivided into small grid cells, and a similar rectangle at the lower reference. Add two input boxes for numbers and display corresponding percentage text. Draw arrows and segments between the references to indicate proportional relationships. As the draggable point moves, an extended filled region appears inside the upper rectangle, with length related to the point's x-coordinate, updating dynamically.
The prompt above was compiled from the original drawing commands and is for reference only.