
Percentage of Square Covered by Random Circle
Loading the math board and drawing, please wait…
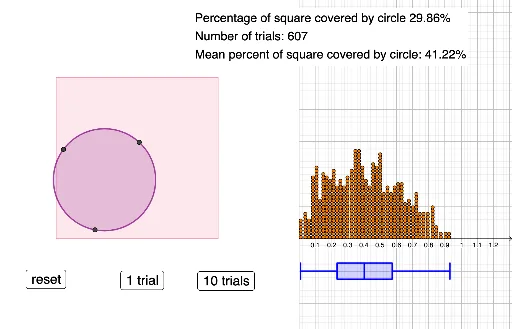
This example demonstrates the percentage of a square covered by a random circle. Key mathematical concepts include probability and geometry. Using GeoGebra commands such as Polygon, Flatten, RandomPointIn, Circle, DotPlot, etc., a dynamic graphical representation of the random circle covering the square is constructed. Suitable for high school and above students or teachers for teaching and research.
GeoGebra Commands & Parameters
Polygon((-1.5, 0), (-0.5, 0), 4) → poly1Flatten(Sequence[Sequence[(a, b), a, -1.5, -0.5, 0.025], b, 0, 1, 0.025]) → l1RandomPointIn(poly1) → ARandomPointIn(poly1) → BRandomPointIn(poly1) → CCircle(A, B, C) → cDotPlot(data, true) → l3BoxPlot(-0.2, 0.05, data) → eSequence(IsInRegion[Element[l1, w], c] ∧ IsInRegion[Element[l1, w], poly1], w, 1, Length[l1]) → l2Sum(l2) → aLength(l2) → b
AI Drawing Prompt Reference
Draw a square and generate three random points inside it. Use these points to draw a circle, showing the coverage of the circle on the square. Generate a large number of random points inside the square, count the points that fall within the circle, and plot them as a dot plot and a box plot to represent the data distribution. Finally, calculate and display the percentage of points inside the circle to visually show the proportion of the square covered by the circle.
The prompt above was compiled from the original drawing commands and is for reference only.