
Part, Whole, and Percentage Relationship
Loading the math board and drawing, please wait…
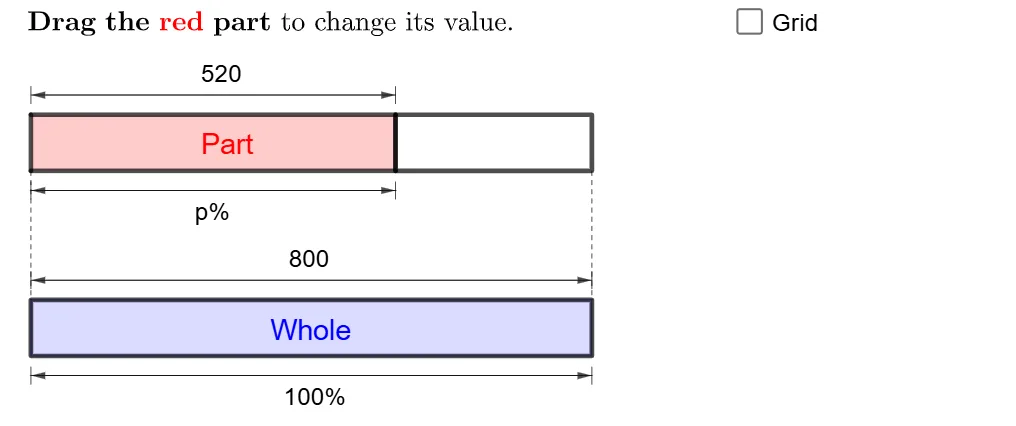
This example demonstrates the mathematical relationship between part, whole, and percentage, visually explaining proportion concepts. Key math concepts include percentage calculation, ratio relationships, and geometric representation. GeoGebra commands and objects used in construction are Point, If, Polygon, Sequence, Textfield, Segment, and Vector. Suitable for middle school and above mathematics education, explaining percentages, ratios, and geometric applications.
GeoGebra Commands & Parameters
Point(yAxis) → APoint(yAxis) → BIf(x(P) ≤ 10, P, (x(P), y(B))) → P0If(x(P) ≤ 10, A + (10, 0), B + (10, 0)) → A0Polygon({P0, A0, A0 + (0, 1), P0 + (0, 1)}) → q2Polygon(P, Q, (0, y(Q)), (0, y(P))) → q1, p_1, q, g, hPolygon({B, B + (10, 0), B + (10, 1), B + (0, 1)}) → q3Polygon({B, B + (10, 0), B + (10, 1), B + (0, 1)}) → q4Sequence(Segment[B + (i, 0), B + (i, 1)], i, 1, 9, 1) → l1Sequence(Sequence[Segment[B + (j + i, 0), B + (j + i, 1)], j, 0, 9, 1], i, 0.1, 0.9, 0.1) → l2Sequence(Segment[A + (i, 0), A + (i, 1)], i, 1, 9, 1) → l3Sequence(Sequence[Segment[A + (j + i, 0), A + (j + i, 1)], j, 0, 9, 1], i, 0.1, 0.9, 0.1) → l4Textfield(n) → InputBox1Textfield(m) → InputBox2If(a, "p", (p * "")) → ptextIf(b, "m", (m * "")) → mtextIf(c, "n", (n * "")) → ntextSegment(A + (0, 1.2), A + (0, 1.5)) → iSegment(P + (0, 1.2), P + (0, 1.5)) → jVector(Midpoint[i], Midpoint[j]) → uVector(Midpoint[j], Midpoint[i]) → vSegment(A - (0, 0.2), A - (0, 0.5)) → kSegment(P - (0, 0.2), P - (0, 0.5)) → lVector(Midpoint[k], Midpoint[l]) → wVector(Midpoint[l], Midpoint[k]) → eSegment(B + (0, 1.2), B + (0, 1.5)) → fSegment(B + (10, 1.2), B + (10, 1.5)) → rVector(Midpoint[f], Midpoint[r]) → sVector(Midpoint[r], Midpoint[f]) → tSegment(B - (0, 0.2), B - (0, 0.5)) → f_1Segment(B + (10, -0.2), B + (10, -0.5)) → g_1Vector(Midpoint[f_1], Midpoint[g_1]) → u_1Vector(Midpoint[g_1], Midpoint[f_1]) → v_1If(a, "p", If[b, "m", "n"]) → text12Sequence(Segment[A + (10 + i, 0), A + (10 + i, 1)], i, 0.1, x(P) - 10, 0.1) → l6Sequence(Segment[A + (10 + i, 0), A + (10 + i, 1)], i, 0, floor(x(P) - 10)) → l5Segment(A, B + (0, 1)) → h_1Segment(If[x(P) ≤ 10, A + (10, 0), P], If[x(P) ≤ 10, B + (10, 1), x(P)]) → i_1Sequence(Segment[A0 + (i, 0), A0 + (i, 1)], i, 0, floor(x(P0) - 10)) → l7Sequence(Segment[A0 + (i, 0), A0 + (i, 1)], i, 0.1, x(P0) - 10, 0.1) → l8
AI Drawing Prompt Reference
Create a geometric diagram to illustrate the relationship between part, whole, and percentage. Start by drawing two vertical lines and placing two points on them, adjusting one based on a condition. Construct several polygons using these points to form a rectangle and two rectangles, representing the whole and parts. Add multiple line segments to divide the shapes, and include text boxes for inputting values to calculate and display percentages. Finally, connect key points with diagonals and use vectors to show directional relationships.
The prompt above was compiled from the original drawing commands and is for reference only.