
Parametric Solutions Demo
Loading the math board and drawing, please wait…
In collections
Exploring Systems
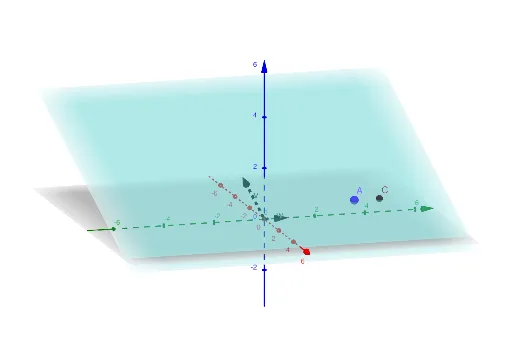
This example demonstrates how to plot geometric shapes and function graphs using parametric equations. It involves core math concepts like parametric equations, vectors, sphere, normal distribution, logarithmic functions, fractions, and decimals. Construction highlights include using GeoGebra objects A, eq1, v, w, s, r, C, text1, eq2. Suitable for high school students and educators to understand the application of parametric equations in geometry and functions.
GeoGebra Commands & Parameters
(2, 3, 1)x + (3 * z) = 5(-3, 0, 1)(0, 1, 0)01A + (s * v) + (r * w)x + (3 * z) = 0