
Parametric curves on intervals
Loading the math board and drawing, please wait…
In collections
MATH1052-edX
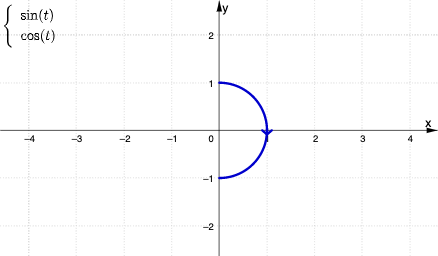
This example demonstrates the plotting of parametric curves on intervals. Key mathematical concepts include parametric equations, interval definitions, and curve generation. Construction involves GeoGebra commands such as CurveCartesian, Segment, and Textfield. Suitable for high school students or college undergraduates learning parametric equations and geometric constructions.
GeoGebra Commands & Parameters
Textfield(f) → inp1Textfield(g) → inp2Textfield(max) → inp2nTextfield(min) → inp1nCurveCartesian(f(u), g(u), u, min, max) → curveSegment(curve(medMinus), curve(medPlus)) → v
AI Drawing Prompt Reference
Plot parametric curves by entering expressions for x(t) and y(t), and the range of parameter t. First, input x(t) and y(t), then input the minimum and maximum values of t. Generate the parametric curve based on the inputs and draw a segment connecting the endpoints of the curve at the middle.
The prompt above was compiled from the original drawing commands and is for reference only.