
Parabola Cross Sections Demo
Loading the math board and drawing, please wait…
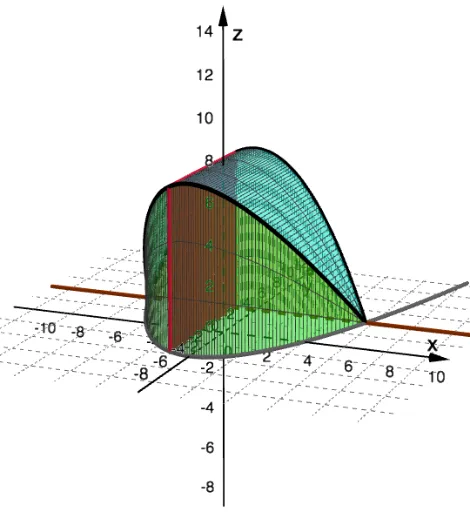
This example demonstrates the 3D shape of a parabola by visualizing various cross-sections through its base. Key math concepts include Calculus, Integral Calculus, Parabola geometry, Solid Geometry, and Similarity Transformation. GeoGebra commands used in construction are IndexOf, Intersect, Polygon, CurveCartesian, Surface, Segment, Midpoint, and CircumcircleSector. It is suitable for high school students and math enthusiasts to understand parabola-related geometry and calculus concepts, serving as an educational tool for visualization and learning.
GeoGebra Commands & Parameters
IndexOf(SelectedElement[shape], shape) → aIntersect(f, g, 1) → AIntersect(f, g, 2) → BPolygon((b, f(b), 0), (b, 4, 0), (b, 4, 4 - f(b)), (b, f(b), 4 - f(b))) → q1, h, i, j, kCurveCartesian(t, 4, 4 - f(t), t, x(A), x(B)) → cCurveCartesian(t, f(t), 4 - f(t), t, x(A), x(B)) → dSurface(t, f(t), (u * z(d(t))), t, x(A), x(B), u, 0, 1) → eSurface(t, 4, (u * z(c(t))), t, x(A), x(B), u, 0, 1) → lSurface(t, (u * f(t)) + ((1 - u) * 4), z(c(t)), t, x(A), x(B), u, 0, 1) → mPolygon((b, f(b), 0), ((-b), f((-b)), 0), ((-b), f((-b)), (2 * abs(b))), (b, f(b), (2 * abs(b)))) → q2, n, q, r, sCurveCartesian(t, f(t), (2 * t), t, 0, x(B)) → oCurveCartesian((-t), f((-t)), (-2 * (-t)), t, 0, x(B)) → ttSurface(t, f(t), (u * z(o(t))), t, 0, x(B), u, 0, 1) → uuSurface((-t), f(t), ((-u) * z(tt((-t)))), t, 0, x(B), u, 0, 1) → vvSurface((u * x(o(t))) + ((1 - u) * x(tt(t))), (u * y(o(t))) + ((1 - u) * y(tt(t))), (u * z(o(t))) + ((1 - u) * z(tt(t))), t, 0, x(B), u, 0, 1) → uCurveCartesian(t, t(t), ((t(t) - f(t)) * sqrt(3)), t, x(A), x(B)) → vSurface(t, (u * f(t)) + ((1 - u) * y(v(t))), ((1 - u) * z(v(t))), t, x(A), x(B), u, 0, 1) → wSurface(t, (u * g(t)) + ((1 - u) * y(v(t))), ((1 - u) * z(v(t))), t, x(A), x(B), u, 0, 1) → a_1Polygon((b, f(b), 0), (b, 4, 0), v(b)) → t1, f_1, g_1, h_1Surface(t, t(t) + ((t(t) - f(t)) * cos(u)), ((t(t) - f(t)) * sin(u)), t, x(A), x(B), u, 0, π) → b_1Segment((b, f(b), 0), (b, 4, 0)) → i_1Midpoint(i_1) → CCurveCartesian(x(C), (i_1 / 2 * cos(t)) + y(C), (i_1 / 2 * sin(t)), t, 0, π) → c_1CircumcircleSector((b, f(b), 0), c_1(π / 2), (b, 4, 0)) → d_1CurveCartesian(t, f(t), 4 - f(t), t, x(A), x(B)) → e_1Surface(t, f(t), (u * z(e_1(t))), t, x(A), x(B), u, 0, 1) → j_1Surface(t, (u * f(t)) + ((1 - u) * g(t)), (u * z(e_1(t))), t, x(A), x(B), u, 0, 1) → k_1Polygon((b, f(b), 0), (b, 4, 0), e_1(b)) → t2, l_1, m_1, n_1
AI Drawing Prompt Reference
Visualize the 3D shape of a parabola by drawing various cross-sections through its base. Start by plotting the intersections of the parabola with two lines, then construct the base polygon using these points. Generate two curves from these points and create surfaces using them to represent the sides of the parabola. Add auxiliary shapes like cross-sections and arcs to enhance the 3D effect.
The prompt above was compiled from the original drawing commands and is for reference only.