
Overlapping Absolute Value Graphs
Loading the math board and drawing, please wait…
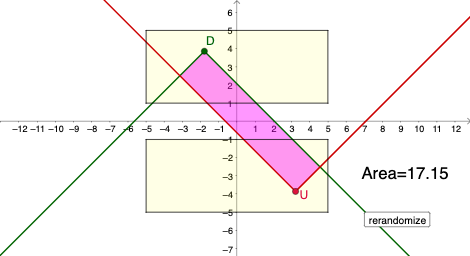
This example demonstrates overlapping absolute value function graphs, combining geometry and probability. Key mathematical concepts include absolute value functions, random point generation, and geometric construction. Construction involves GeoGebra commands like Polygon, RandomPointIn, and Intersect. Suitable for high school students or math enthusiasts to understand function graphs and geometric relationships.
GeoGebra Commands & Parameters
Polygon(A_{1}, B_{1}, C, D_{1}) → q1, a, b, c, dPolygon(E, F, G, H) → q2, e, f, g, hRandomPointIn(q1) → DRandomPointIn(q2) → UIntersect(p, q, -20, 20) → I, JPolygon(U, I, D, J) → q3, u, i, d_1, j
AI Drawing Prompt Reference
Draw two overlapping absolute value function graphs, one with points A, B, C, D and the other with points E, F, G, H. Randomly generate a point D in the first graph and a point U in the second graph. Then find the intersection points I and J of these two graphs within the range of -20 to 20. Finally, use points U, I, D, and J to draw a new shape.
The prompt above was compiled from the original drawing commands and is for reference only.