
OR Logic Gate Demonstration
Loading the math board and drawing, please wait…
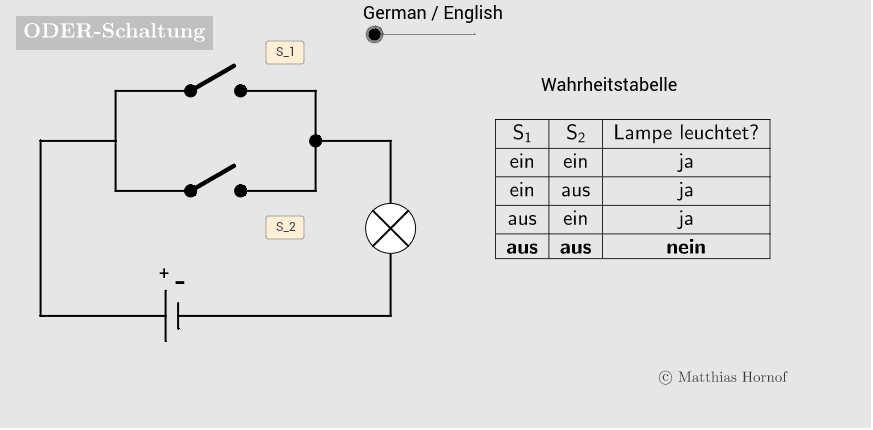
This example demonstrates the graphical representation and truth table of the OR gate (or gate) in logic circuits. It involves core mathematical concepts such as logical operations, Boolean algebra, and set operations. The construction uses GeoGebra commands/objects like Segment (line segment), Midpoint (midpoint), Circle (circle), TableText (table text), and Element (element). Suitable for students in 5th grade and above to understand basic logic circuits and Boolean algebra.
GeoGebra Commands & Parameters
Segment(B_0, If[w1, B_1, C_4]) → l_1Midpoint(A_4, A_5) → LSegment(C_0, If[w2, C_1, C_3]) → l_2Circle(L, 0.5) → cSegment(L - (sqrt(2) / 4, sqrt(2) / 4), L + (sqrt(2) / 4, sqrt(2) / 4)) → k_1Segment(L - (sqrt(2) / 4, (-sqrt(2)) / 4), L + (sqrt(2) / 4, (-sqrt(2)) / 4)) → k_2Segment(A_3, A_2) → dSegment(A_4, A_5) → fSegment(A_5, G) → gSegment(A_2, A_1) → hCircle(L, 0.5) → c_2Segment(H_1, H_2) → h_1Segment(G_1, G_2) → h_2Segment(A_6, A_3) → bSegment(A_7, A_9) → iSegment(A_7, B_0) → jSegment(A_9, C_0) → kSegment(B_1, A_8) → aSegment(C_1, A_{10}) → eMidpoint(A_8, A_{10}) → A_{11}Segment(A_8, A_{10}) → lSegment(A_{11}, A_4) → mTableText({{LaTeX["S_1"], LaTeX["S_2"], LaTeX[Element[lampLit, n]]}, {LaTeX[If[w1 ∧ w2, "\mathbf", ""] + (Element[einList, n])], LaTeX[If[w1 ∧ w2, "\mathbf", ""] + (Element[einList, n])], LaTeX[If[w1 ∧ w2, "\mathbf", ""] + (Element[jaList, n])]}, {LaTeX[If[w1 ∧ (¬w2), "\mathbf", ""] + (Element[einList, n])], LaTeX[If[w1 ∧ (¬w2), "\mathbf", ""] + (Element[ausList, n])], LaTeX[If[w1 ∧ (¬w2), "\mathbf", ""] + (Element[jaList, n])]}, {LaTeX[If[(¬w1) ∧ w2, "\mathbf", ""] + (Element[ausList, n])], LaTeX[If[(¬w1) ∧ w2, "\mathbf", ""] + (Element[einList, n])], LaTeX[If[(¬w1) ∧ w2, "\mathbf", ""] + (Element[jaList, n])]}, {LaTeX[If[(¬w1) ∧ (¬w2), "\mathbf", ""] + (Element[ausList, n])], LaTeX[If[(¬w1) ∧ (¬w2), "\mathbf", ""] + (Element[ausList, n])], LaTeX[If[(¬w1) ∧ (¬w2), "\mathbf", ""] + (Element[neinList, n])]}}, "|_c") → text1Element(truthTable, n) → text3
AI Drawing Prompt Reference
Draw a graphical representation of an OR logic gate circuit, including input and output line segments, a circle representing a light bulb, and a table showing the truth table. Connect the input line segments with straight lines, place a circle at the midpoint of the input segments to represent the light bulb, and include a table with four rows and three columns to display the output states for different input combinations, highlighting the results with bold text.
The prompt above was compiled from the original drawing commands and is for reference only.