
Open Middle Non-Linear Correlation
Loading the math board and drawing, please wait…
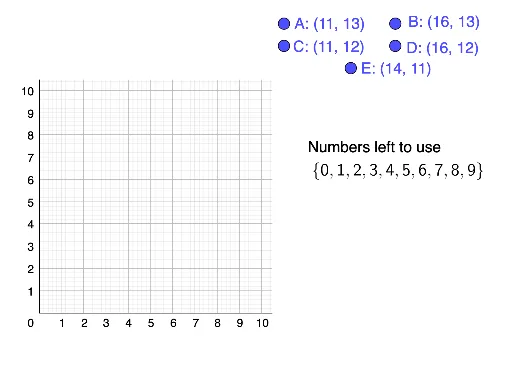
① This GeoGebra example demonstrates how adjusting scattered points can illustrate non-linear correlation versus linear correlation, challenging students to construct configurations meeting specific statistical targets. ② Core mathematical concepts include correlation, median value in probability, derivatives, tangent functions, and numerical computation, linking data distribution to curve behavior. ③ Construction details: uses the Remove command to clear defaults, LaTeX for mathematical typesetting, Polygon to create polygonal regions (possibly marking data bounds), and objects A, B, C, D, E, numbers, coor, l1, text2, poly1, and text1 for interactive manipulation. ④ Suitable for high school or early college statistics and calculus courses, this open-middle task fosters exploration of non-linear fitting, correlation strength, and tangent slope interpretation, promoting mathematical modeling and critical thinking.
GeoGebra Commands & Parameters
Remove(numbers, coor) → l1LaTeX(l1, true) → text2Polygon((-1, -1), (10.5, -1), 4) → poly1
AI Drawing Prompt Reference
Create a graph showing scattered points and a curve to illustrate the difference between non-linear and linear correlation. Include a quadrilateral at the bottom to mark data bounds. Allow users to adjust the points to meet specific statistical targets, displaying relevant mathematical formulas and tangent lines to analyze the relationship between data distribution and curve behavior.
The prompt above was compiled from the original drawing commands and is for reference only.