
Open Intro Week 1: Treating Chronic Fatigue Syndrome
Loading the math board and drawing, please wait…
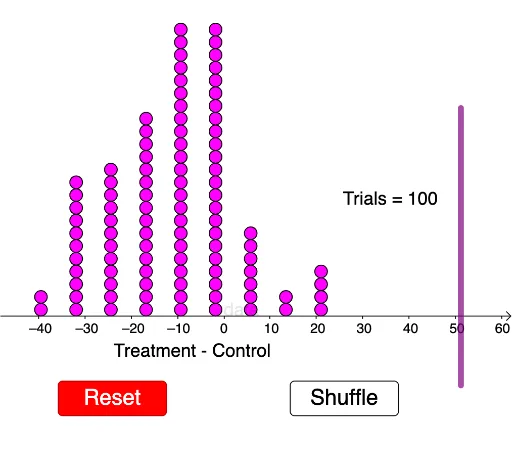
This example demonstrates how to use GeoGebra to construct a data analysis model for treating Chronic Fatigue Syndrome. It involves core mathematical concepts such as Conditional Probability, Frequency Distribution, Hypothesis Testing, Probability, Statistics, Stochastic Process, and Confidence Interval. The construction utilizes commands like Join, Shuffle, Take, Sum, DotPlot, Segment, and objects including B1, C1, A2, A3, B2, C2, D2, B3, C3, D3, D1, A4, B4, C4, Cards, D4, CardsShuffle, A10, A11, A12, B9, C9, D9, D10, D11, D12, B12, C12, l1, l2, B10, B11, C10, C11, F2, F3, F1, F10, F11, E4. It is suitable for high school students and above, particularly those interested in statistics.
GeoGebra Commands & Parameters
Join({Sequence[1, a, 1, 24], Sequence[0, a, 1, 29]}) → CardsShuffle(Cards) → CardsShuffle, {1, 1, 0, 0, 0, 0, 1, 1, 1, 0, 1, 0, 1, 1, 1, 0, 0, 0, 0, 0, 1, 1, 0, 0, 0, 0, 1, 0, 0, 1, 1, 0, 1, 0, 1, 1, 0, 0, 0, 0, 1, 0, 0, 0, 1, 1, 0, 1, 1, 0, 1, 0, 1}Take(CardsShuffle, 1, 24) → l1Take(CardsShuffle, 25, 53) → l2Sum(l1) → B10Sum(l2) → B11DotPlot(data, true) → l3Segment((51.2, -5), (51.2, 15)) → f