
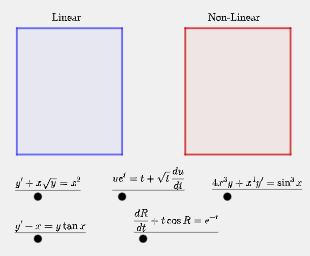
ODEs: Linear or Non-linear?
Loading the math board and drawing, please wait…
In collections
MATH1052-edX
This example demonstrates how to identify the linearity or non-linearity of ordinary differential equations using GeoGebra. Key concepts include ordinary differential equations, vectors, and functions. Using commands like Polygon, Translate, IsInRegion, and If, users can dynamically explore the properties of the equations. Suitable for high school math teachers and students.
GeoGebra Commands & Parameters
Polygon(A, B, C, D) → q1, f, g, h, iTranslate(A, v) → A'Translate(B, v) → B'Translate(C, v) → C'Translate(D, v) → D'Polygon(Translate[A, v], Translate[B, v], Translate[C, v], Translate[D, v]) → q2, j, k, l, mIsInRegion(A1, q2) → a1IsInRegion(A2, q1) → a2IsInRegion(A3, q1) → a3IsInRegion(A4, q2) → a4IsInRegion(A5, q1) → a5If(a1 ∧ a2 ∧ a3 ∧ a4 ∧ a5, true, false) → checkIsInRegion(A1, q1) → b1IsInRegion(A2, q1) → b2IsInRegion(A3, q1) → b3IsInRegion(A4, q1) → b4IsInRegion(A5, q1) → b5IsInRegion(A1, q2) → c1IsInRegion(A2, q2) → c2IsInRegion(A3, q2) → c3IsInRegion(A4, q2) → c4IsInRegion(A5, q2) → c5If(b1 ∨ b2 ∨ b3 ∨ b4 ∨ b5 ∨ c1 ∨ c2 ∨ c3 ∨ c4 ∨ c5, true, false) → inside
AI Drawing Prompt Reference
Draw a graph composed of multiple points that are translated by vectors to form a new graph. Check whether these points lie within the original and transformed graphs, and determine if the graph is linear or nonlinear based on the conditions.
The prompt above was compiled from the original drawing commands and is for reference only.