
Normal vs. Standard Normal Distribution (Interval)
Loading the math board and drawing, please wait…
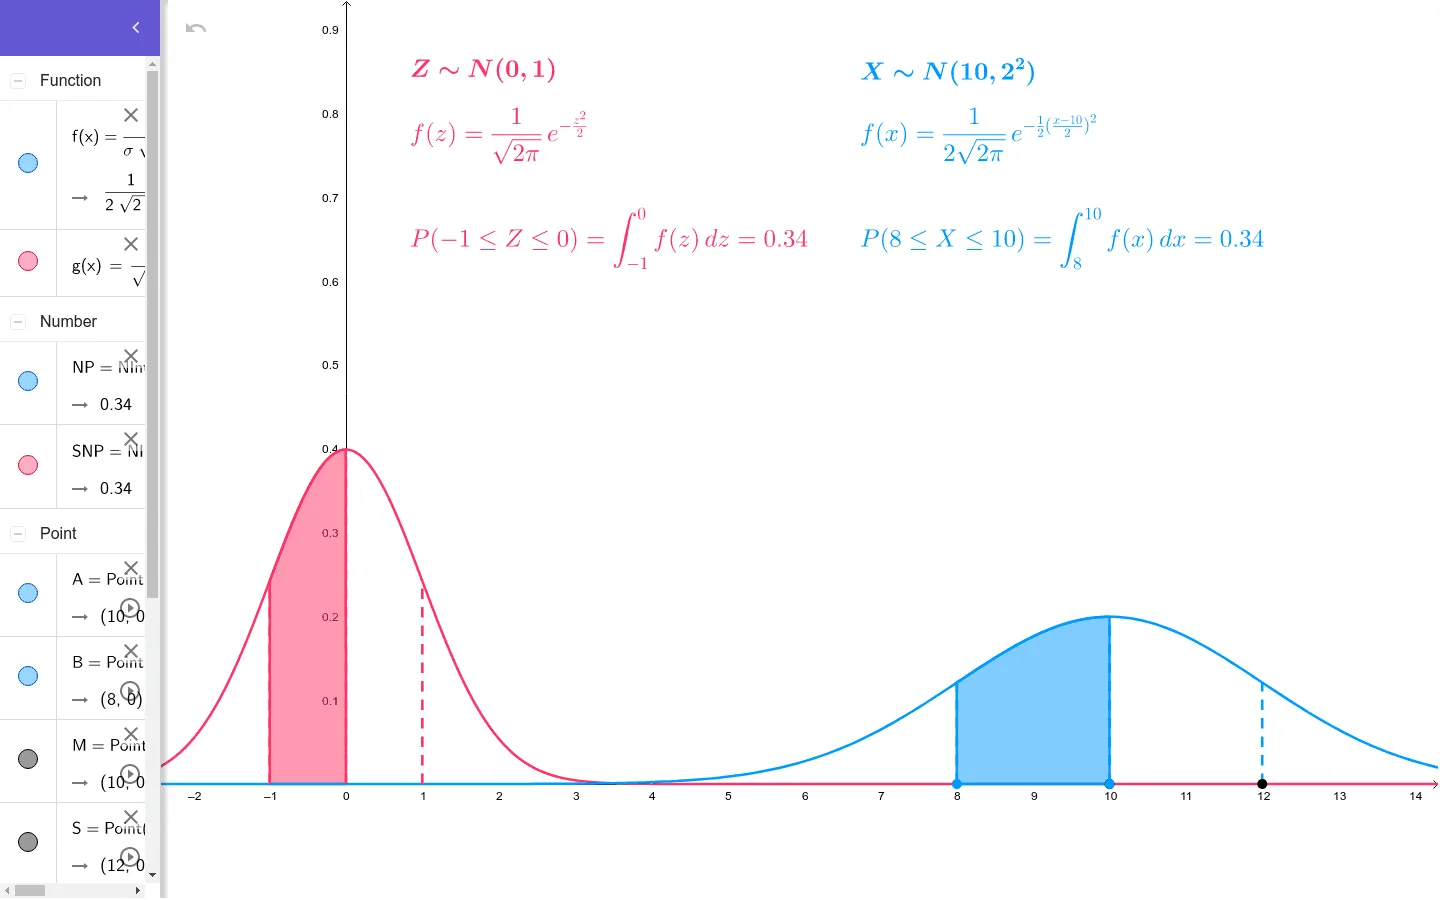
This example demonstrates the differences between normal distribution and standard normal distribution, involving key concepts in probability and statistics. Using commands like Point, Max, Min, NIntegral, Segment, etc., it shows how to plot normal and standard normal distributions in GeoGebra. Suitable for high school and above students studying probability and statistics.
GeoGebra Commands & Parameters
Point(xAxis) → APoint(xAxis) → BPoint(xAxis) → MPoint(xAxis) → SMax(x(A), x(B)) → bMin(x(A), x(B)) → aNIntegral(f, a, b) → NPNIntegral(g, a', b') → SNPSegment((μ, 0), (μ, f(μ))) → hSegment((μ + σ, 0), (μ + σ, f(μ + σ))) → iSegment((μ - σ, 0), (μ - σ, f(μ - σ))) → jSegment((0, 0), (0, g(0))) → kSegment((1, 0), (1, g(1))) → lSegment((-1, 0), (-1, g(-1))) → m
AI Drawing Prompt Reference
Draw the normal distribution and standard normal distribution. First, create four points on the x-axis, then find the maximum and minimum x-coordinates of points A and B to determine the interval [a, b]. Calculate the integrals NP and SNP for the normal and standard normal distributions over this interval. Finally, draw vertical lines at μ, μ+σ, μ-σ, and 0, 1, -1.
The prompt above was compiled from the original drawing commands and is for reference only.