
Normal Distribution with Mean and Standard Deviation
Loading the math board and drawing, please wait…
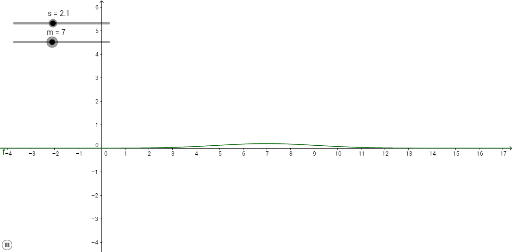
① This GeoGebra example dynamically demonstrates how the normal distribution curve changes its position and spread as the mean (m) and standard deviation (s) are adjusted, providing a visual representation of the probability density function. ② Core mathematical concepts include the normal distribution, mean as a location parameter, standard deviation as a scale parameter, probability density function, and the relationship between the area under the curve and probability. ③ Construction highlights: sliders are used to control parameters m and s, a function f(x) defines the normal density curve, and the graph is plotted accordingly; other geometric objects (such as cones, parallelograms, cylinders) may appear as auxiliary elements, but the main construction relies on objects s, m, and f. ④ Suitable for high school to college-level probability and statistics instruction, ideal for classroom demonstrations, student exploration of how parameters affect distribution shape, and understanding empirical rules like the 68-95-99.7 rule.
GeoGebra Commands & Parameters
Numeric s(2.2)Numeric m(7)f(x) = (1 / ((s * sqrt((2 * π)))) * ℯ^((-((x - m)^(2) / ((2 * s^(2)))))))