
PDF/CDF of Two Random Variables by mistermoray
Loading the math board and drawing, please wait…
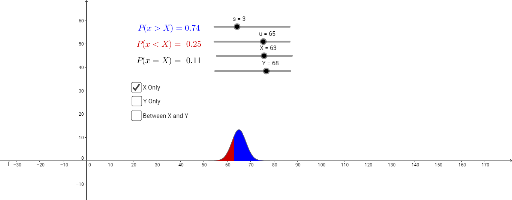
This example demonstrates the graphical representation and calculation of the Probability Density Function (PDF) and Cumulative Distribution Function (CDF) of two random variables. Key math concepts include Probability & Statistics, function graphing, integration, and derivatives. GeoGebra commands like LowerSum for integral calculation and objects such as s, u, f, X, g, a, ba, baSTD, aa, aaSTD, etc., are used to construct the functions and display data. Suitable for high school and above students and teachers for probability and calculus instruction.
GeoGebra Commands & Parameters
LowerSum(f, 0, X, 1000) → baLowerSum(g, 0, X, 1000) → baSTDLowerSum(f, X, 100, 1000) → aaLowerSum(g, X, 100, 1000) → aaSTDLowerSum(f, Y, 100, 1000) → abLowerSum(g, Y, 100, 1000) → abSTDLowerSum(f, 0, Y, 1000) → bbLowerSum(g, 0, Y, 1000) → bbSTDLowerSum(g_1, X, 100, 1000) → aaSTD_1LowerSum(g_2, 0, X, 1000) → baSTD_1LowerSum(f, X, Y, 1000) → betabLowerSum(g, X, Y, 1000) → betaABSTD