
PDF/CDF of Two Random Variables
Loading the math board and drawing, please wait…
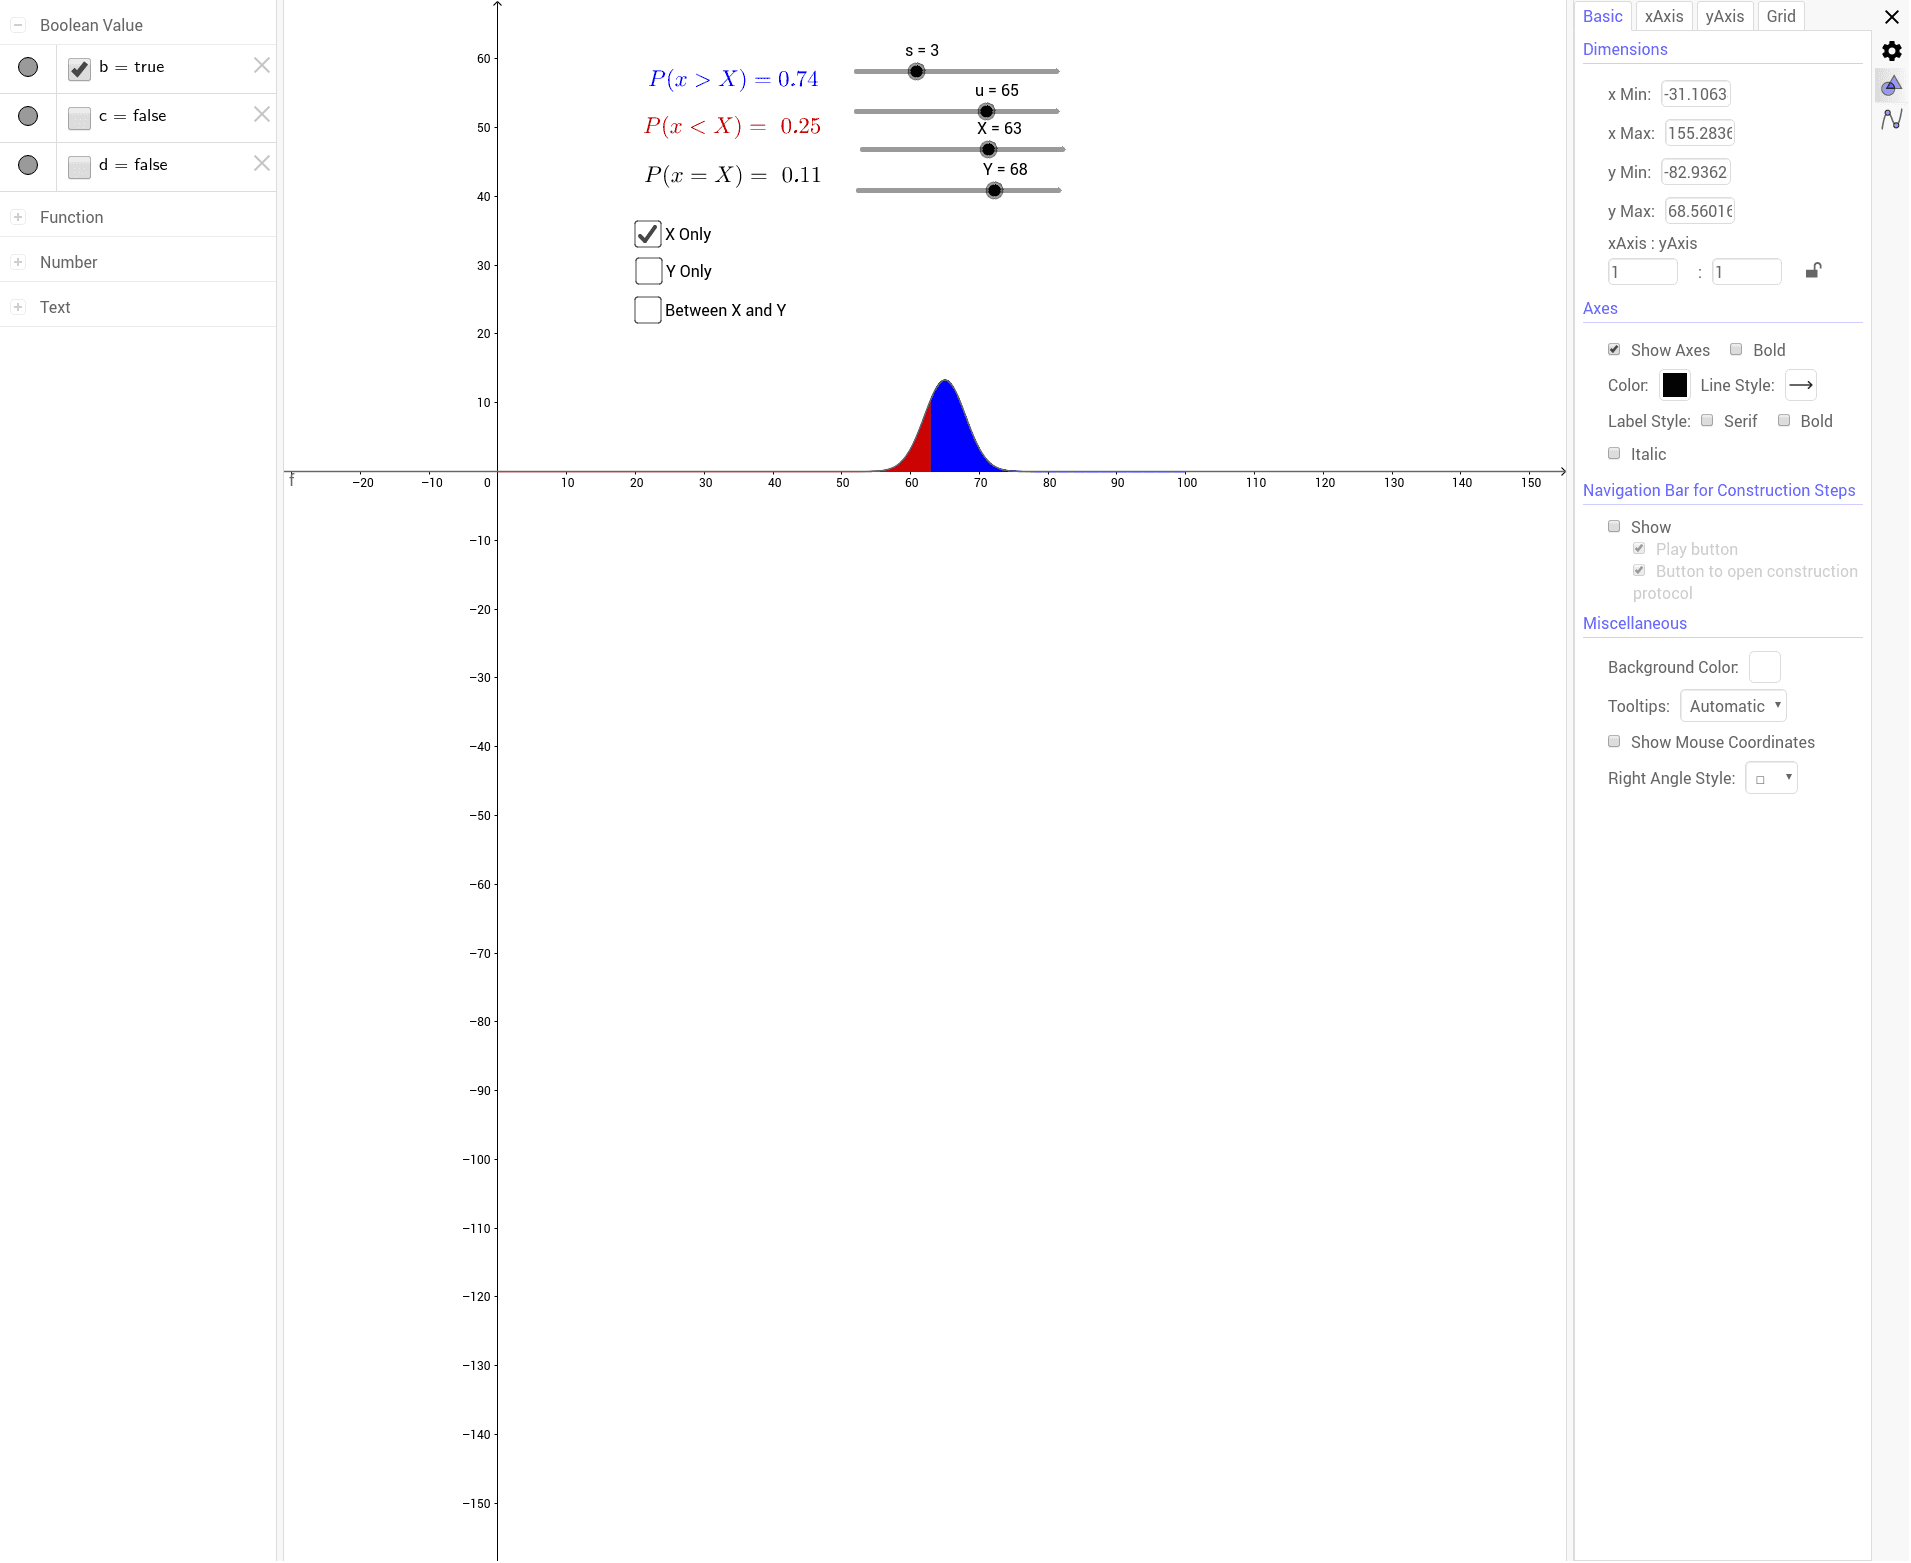
This example demonstrates the probability density function (PDF) and cumulative distribution function (CDF) of two random variables. It involves core concepts in probability and statistics. Using GeoGebra commands like LowerSum, f, g, etc., the probability distribution of random variables can be constructed. Suitable for high school and above students to learn probability and statistics.
GeoGebra Commands & Parameters
LowerSum(f, 0, X, 1000) → baLowerSum(g, 0, X, 1000) → baSTDLowerSum(f, X, 100, 1000) → aaLowerSum(g, X, 100, 1000) → aaSTDLowerSum(f, Y, 100, 1000) → abLowerSum(g, Y, 100, 1000) → abSTDLowerSum(f, 0, Y, 1000) → bbLowerSum(g, 0, Y, 1000) → bbSTDLowerSum(g_1, X, 100, 1000) → aaSTD_1LowerSum(g_2, 0, X, 1000) → baSTD_1LowerSum(f, X, Y, 1000) → betabLowerSum(g, X, Y, 1000) → betaABSTD
AI Drawing Prompt Reference
Plot the probability density function (PDF) and cumulative distribution function (CDF) for two random variables, including the PDF and CDF of functions f and g, respectively on the X and Y axes, using 1000 rectangles for approximation.
The prompt above was compiled from the original drawing commands and is for reference only.