
Normal Distribution Probability Calculation by oyunchimegmath
Loading the math board and drawing, please wait…
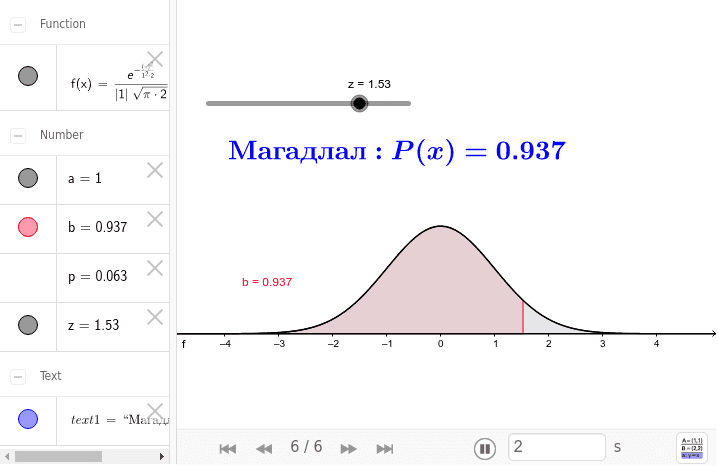
This example demonstrates how to calculate probabilities for a normal distribution. It involves core math concepts like normal distribution, scatter plot, definite integral, mode, hyperbola, and random experiments. Construction highlights include using the Normal command to plot the function f and the Integral command for definite integration, with objects f, z, b, p, a, text1. Suitable for high school students and math enthusiasts learning probability & statistics.
GeoGebra Commands & Parameters
Normal(0, 1, x) → fIntegral(f, -6, z) → bIntegral(f, -6, 6) → a
AI Drawing Prompt Reference
Draw a normal distribution probability calculation graph, showing the normal distribution curve and integral areas. First, plot the standard normal distribution curve centered at the origin. Then, highlight and calculate the area of the integral from -6 to z, and also highlight and calculate the area from -6 to 6 for the entire distribution, using different colors or shading to distinguish the two integral areas and display the corresponding values.
The prompt above was compiled from the original drawing commands and is for reference only.