
Normal Distribution Investigation: Mean and Standard Deviation
Loading the math board and drawing, please wait…
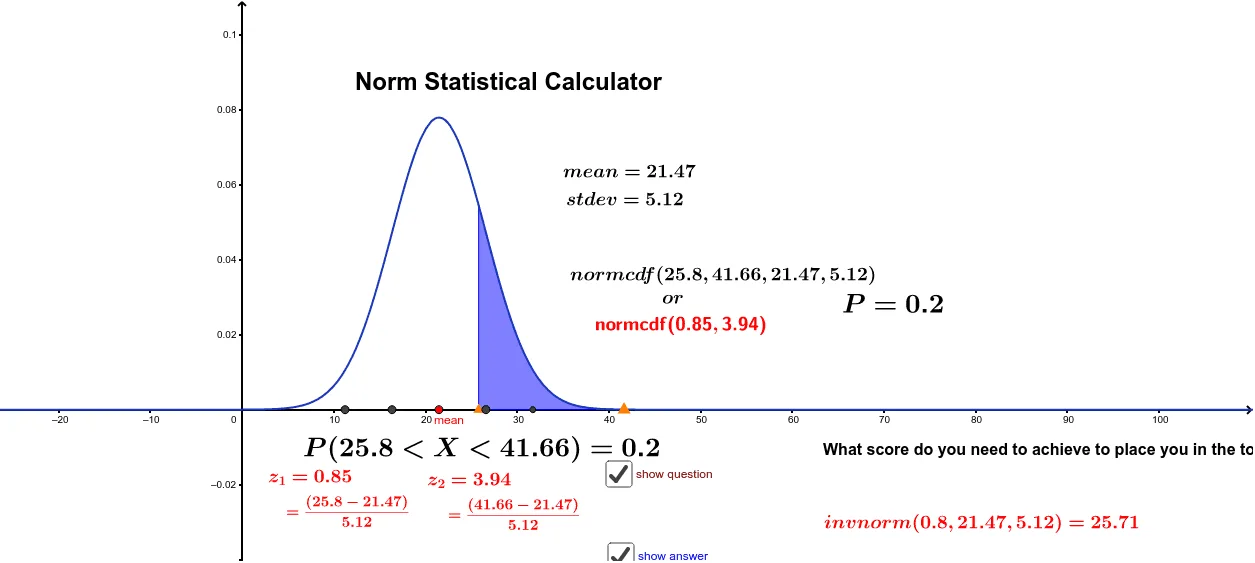
This GeoGebra example demonstrates the Normal Distribution curve and its probability density function. Key concepts include mean, standard deviation, and integration for area calculation. Construction utilizes Point commands for markers and Integral commands to compute shaded regions under the curve, controlled by variables like mn and std. Ideal for high school or college statistics students exploring statistical properties interactively.
GeoGebra Commands & Parameters
Point(xAxis) → APoint(xAxis) → BIntegral(f, x(A), x(B), true) → a