
Matrix Intersection and Conditional Probability Visualization
Loading the math board and drawing, please wait…
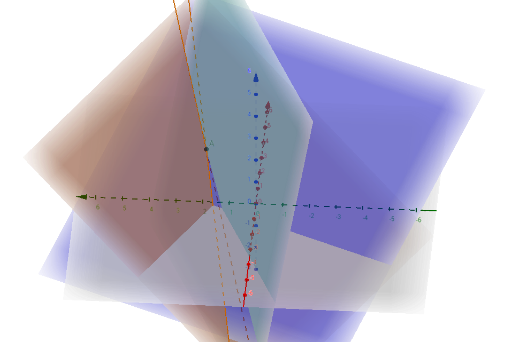
This GeoGebra example constructs a comprehensive geometric model combining matrices, scatter plots, pyramids, conditional probability, line segments, and ratios, demonstrating the intuitive relationship between matrix operations and geometric object intersections. Core mathematical concepts include matrix transformations, intersection solving, geometric representation of conditional probability, and segment ratio relationships. Construction highlights: using IntersectPath and Intersect commands to compute intersections of multiple objects (e.g., lines j, k, l, m with curves a, d, e, f, g), and utilizing points A, B, C to build a pyramid structure, while scatter plots display data distribution and conditional probability is visualized through geometric regions. Suitable for high school to university-level mathematics instruction, this example helps students understand the cross-application of matrices and geometry, as well as the integration of probability with geometric figures.
GeoGebra Commands & Parameters
IntersectPath(a, b) → hIntersectPath(a, c) → iIntersect(h, i) → A
AI Drawing Prompt Reference
Create a 3D geometric scene with two intersecting surfaces or planes whose intersection forms a path, while a third surface or plane intersects each of the first two separately, producing two intersection curves that meet at a single point. The composition should visually connect matrix transformations with geometric intersections, and include a geometric region representing conditional probability, using distinct colors or transparencies. Add a scatter plot to show data distribution, and a pyramid structure built from several points, emphasizing segment ratios. Clearly display all intersection relationships for educational purposes.
The prompt above was compiled from the original drawing commands and is for reference only.