
Standardising Normal Distribution
Loading the math board and drawing, please wait…
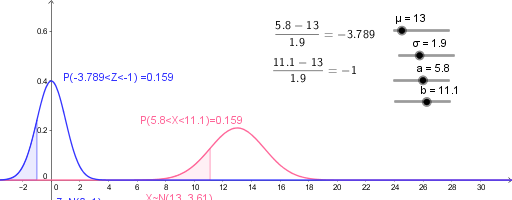
①This example dynamically demonstrates how a normal distribution curve is standardized to the standard normal distribution by adjusting the mean μ and standard deviation σ, and calculates the probability area over a specified interval [a,b]. ②Core mathematical concepts include normal distribution, standardization (z-score transformation), probability density function, and definite integrals for probability. ③Construction highlights: uses GeoGebra's If command to define piecewise functions, Integral command to compute area under the curve, sliders to control parameters μ, σ, a, b, and text objects to display probability values. ④Suitable for high school and college statistics courses, serving as a visual tool to understand the standardization process and probability calculation of normal distributions.
GeoGebra Commands & Parameters
If(a < b, b, a) → qIf(a < b, a, b) → pIntegral(f, p, q) → cIntegral(g, d, e) → h