
Gaussian Success: Visualizing Normal Distribution and Limits
Loading the math board and drawing, please wait…
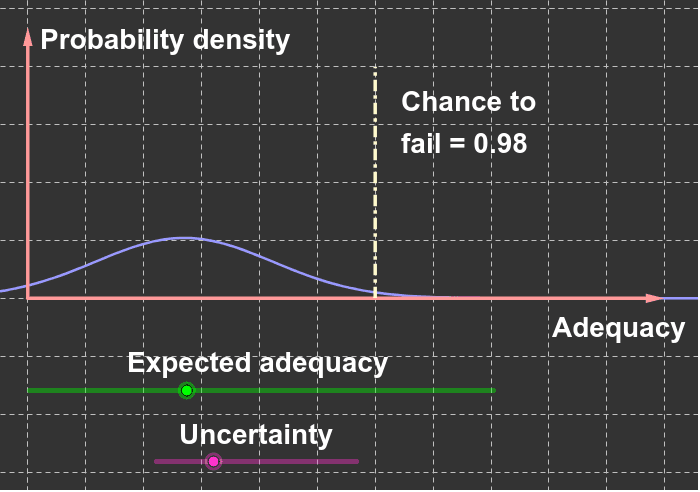
① This GeoGebra example dynamically illustrates the Gaussian (normal) distribution curve and its associated geometric constructions, showing how the probability density function changes with parameters and approaches limits. ② Core mathematical concepts include normal distribution, variance, limits, upper and lower sums (Riemann sums), coordinates, and ratios, bridging abstract statistical ideas with visual geometry. ③ Construction details: using commands such as Point, Vector, Segment, Function, and Intersect, with objects E, A, b, B, v, D, e, a, d, F, C, and multiple text labels (text1_1 to text1_5) to annotate key values and relationships; sliders or parameters likely control the curve's shape. ④ Suitable for high school to undergraduate courses in probability, statistics, and calculus, ideal for demonstrating properties of the normal distribution, limit concepts, or Riemann sum approximations, fostering intuitive understanding.
GeoGebra Commands & Parameters
Point(xAxis) → BVector(A, B) → vPoint(v) → DSegment(D, E) → eFunction(Normal[a, sqrt(b), x, true], -1, 6) → dIntersect(d, e, (3, 0.9845079749507717)) → FPoint(yAxis) → CFunction(ℯ^((-((x - a)^(2) / ((2 * b))))) / sqrt(((2 * π) * b)), -1, 6) → fVector(A, C) → u
AI Drawing Prompt Reference
Draw a Gaussian distribution curve. Start by taking a point B on the x-axis, then create a vector v from A to B, and take a point D on v. Draw a line segment e from D to E. Plot the Gaussian function d, find its intersection F with e, then take a point C on the y-axis and plot another Gaussian function f.
The prompt above was compiled from the original drawing commands and is for reference only.