
Gaussian Distribution & Polygon Interaction Demo
Loading the math board and drawing, please wait…
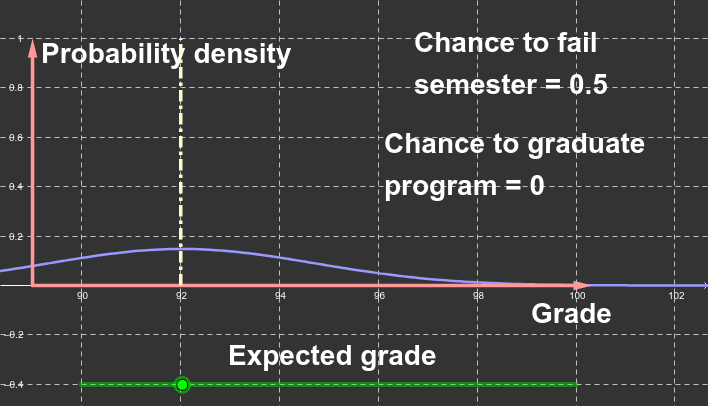
This example demonstrates the interaction between Gaussian probability density functions and polygons (especially triangles), focusing on special points calculation. Core math concepts include probability density, special points, isosceles triangles, exponent functions, geometric distribution, and variance. GeoGebra commands used in construction are Point, Vector, Segment, Function, and Intersect. Suitable for high school and above students to understand the application of probability statistics combined with geometry.
GeoGebra Commands & Parameters
Point(xAxis) → BVector(A, B) → vPoint(v) → DSegment(D, E) → eFunction(Normal[a, sqrt(b), x, true], -1, 6) → dIntersect(d, e, (92, 0.4970428701526212)) → FFunction(ℯ^((-((x - a)^(2) / ((2 * b))))) / sqrt(((2 * π) * b)), 85, 110) → fVector(A, C) → u
AI Drawing Prompt Reference
Draw a Gaussian distribution curve interacting with a triangle. Start by creating point B on the x-axis, then create vector v from A to B and point D on v. Next, create line segment e from D to E, and define the Gaussian distribution function d from -1 to 6. Create point F at the intersection of e and the point (92, 0.497). Finally, define another Gaussian distribution function f from 85 to 110.
The prompt above was compiled from the original drawing commands and is for reference only.