
Sine Curve Approximation with Line Segments
Loading the math board and drawing, please wait…
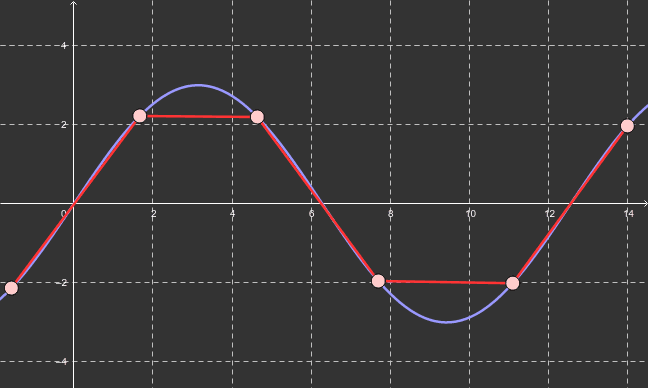
This example demonstrates approximating a sine curve using line segments, illustrating the method of approximating a trigonometric function. Using GeoGebra commands like Point and Segment, the number of line segments can be adjusted to observe the approximation effect. Suitable for high school mathematics education, aiding students in understanding the properties of the sine function.
GeoGebra Commands & Parameters
Point(f) → APoint(f) → BSegment(A, B) → aPoint(f) → EPoint(f) → FSegment(E, F) → cPoint(f) → GSegment(F, G) → dSegment(B, E) → bPoint(f) → CSegment(G, C) → e
AI Drawing Prompt Reference
Draw a sine curve and approximate it using multiple line segments to illustrate the method of approximating a trigonometric function. Start by drawing two line segments, then add more line segments between these two segments. Adjusting the number of line segments allows you to observe the approximation effect, suitable for high school mathematics education to help students understand the properties of the sine function.
The prompt above was compiled from the original drawing commands and is for reference only.