
Normal Distribution Explorer
Loading the math board and drawing, please wait…
In collections
MA336
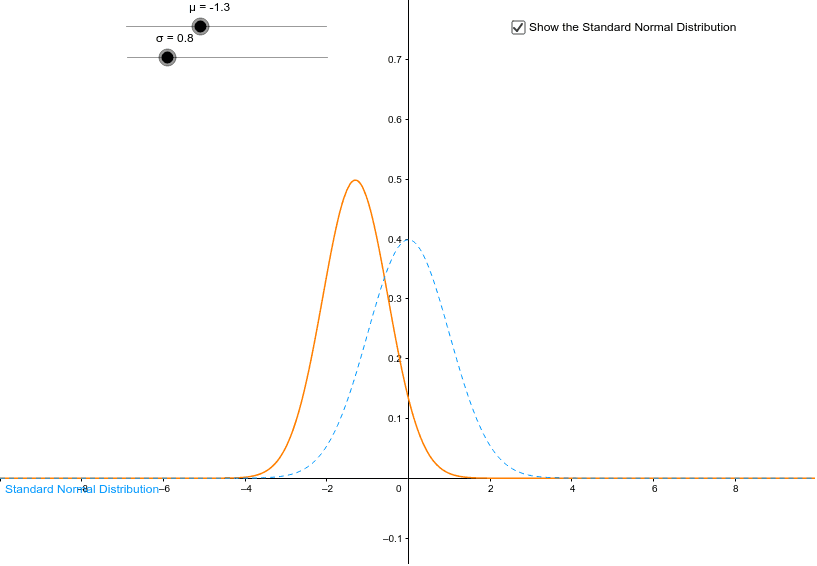
This example demonstrates how adjusting the mean (μ) and standard deviation (σ) affects the normal distribution curve. Key math concepts include normal distribution, mean, standard deviation, and probability density function. Constructed using GeoGebra commands: Normal for μ, σ, f, g, and a. Suitable for high school and above students to explore the properties of normal distribution and the impact of its parameters.
GeoGebra Commands & Parameters
Normal(μ, σ, x) → fNormal(0, 1, x) → g
AI Drawing Prompt Reference
Draw a graph showing how the normal distribution curve changes with mean and standard deviation, including two curves where one is the standard normal distribution and the other can be adjusted by sliders for mean and standard deviation, displaying the probability density function.
The prompt above was compiled from the original drawing commands and is for reference only.