
Geometric View of Complex Exponential Functions
Loading the math board and drawing, please wait…
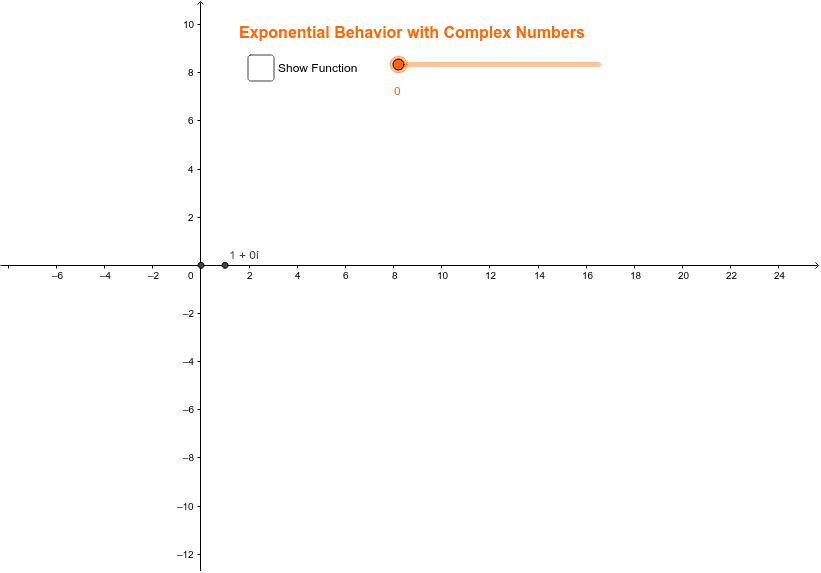
This example demonstrates the geometric representation of the complex exponential function (1+i)^x. Key mathematical concepts include complex numbers, exponential functions, and coordinate geometry. Using GeoGebra commands such as Intersect, Point, Polygon, and CurveCartesian, a dynamic graphical representation of the complex exponential function is constructed. Suitable for high school mathematics education and learning about complex numbers and exponential functions.
GeoGebra Commands & Parameters
Intersect(xAxis, yAxis) → APoint(xAxis) → BPolygon(A, B, C) → poly1, c, a, bPolygon(A, D, C) → poly2, c_1, a_1, dPolygon(A, D, E) → poly3, e, a_2, d_1Polygon(A, F, G) → poly5, g, a_4, f_1Polygon(A, G, H) → poly6, h, a_5, g_1Polygon(A, H, I) → poly7, i, a_6, h_1Polygon(A, I, J) → poly8, j, a_7, i_1CurveCartesian(x((1 + ί)^(t)), y((1 + ί)^(t)), t, 0, 10) → fPolygon(A, E, F) → poly4, f_2, a_3, e_1
AI Drawing Prompt Reference
Draw the geometric representation of the complex exponential function (1+i)^t. Start by plotting points A, B, C, D, E, F, G, H, I, and J on the coordinate axes, then construct polygons poly1 to poly8 using these points. Finally, draw curve f to represent the trajectory of (1+i)^t for t from 0 to 10.
The prompt above was compiled from the original drawing commands and is for reference only.