
Central Limit Theorem Demonstration by Georgia Stuart
Loading the math board and drawing, please wait…
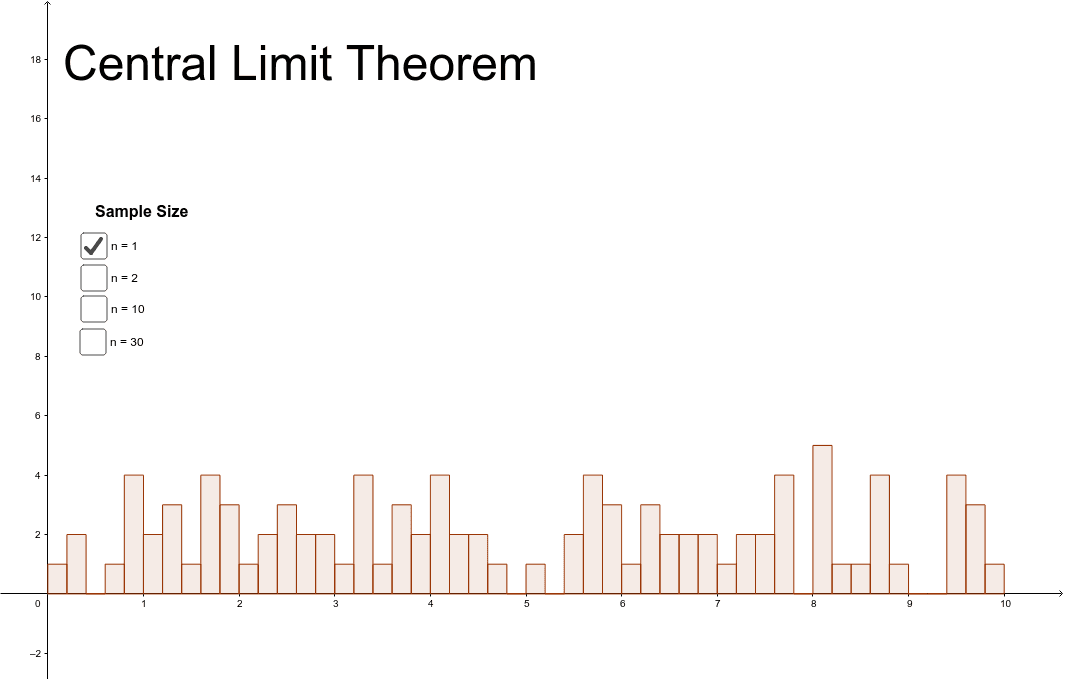
This example demonstrates the Central Limit Theorem on a uniform data set, showing the distribution of sample means with different sample sizes (1, 2, 10, 30). Key math concepts include the Central Limit Theorem, sample mean distribution, and probability & statistics. It uses GeoGebra commands like RandomUniform for data generation, Histogram for plotting histograms, and Text for annotations. Suitable for high school students and math enthusiasts learning probability and statistics.
GeoGebra Commands & Parameters
RandomUniform(0, 10, 100) → sample1Histogram(list1, sample2, false) → bHistogram(list1, sample1, false) → aHistogram(list1, sample10, false) → cHistogram(list1, sample30, false) → dText("Central Limit Theorem") → text1Text("Sample Size") → text2
AI Drawing Prompt Reference
Demonstrate the Central Limit Theorem by generating 100 uniformly distributed data points and plotting histograms for sample means with sizes 1, 2, 10, and 30, annotated with 'Central Limit Theorem' and 'Sample Size'.
The prompt above was compiled from the original drawing commands and is for reference only.