
Minimizing the Difference Between an Exponential Function and Its Derivative
Loading the math board and drawing, please wait…
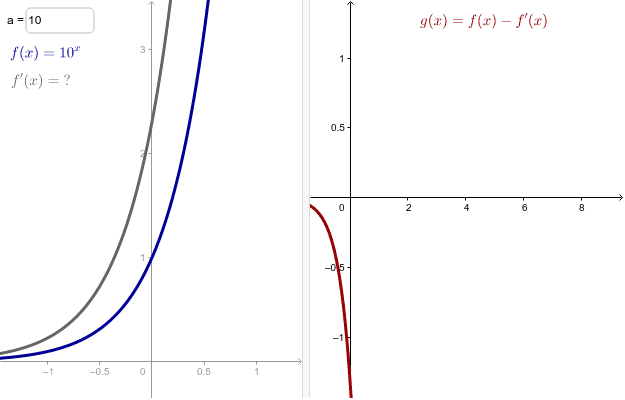
This GeoGebra example dynamically explores the exponential function f(x)=a^x by allowing the user to adjust the base a, and visually compares the function with its derivative f'(x)=a^x·ln a. The goal is to find the base value that minimizes the difference between the two curves, thereby revealing the special role of e. Core mathematical concepts include the derivative of exponential functions, the natural logarithm, and measuring the distance between functions (e.g., via area or maximum vertical gap). The construction uses a Textfield (inputBox1) to input the base a, defines the function f and its derivative f', displays relevant values through text objects (Text1, Text2, Text3), and introduces an auxiliary function g to quantify the difference. Suitable for high school or early college students learning calculus, this interactive tool helps build intuition about why e is the natural base for exponential growth.
GeoGebra Commands & Parameters
Textfield(a) → inputBox1
AI Drawing Prompt Reference
Draw the exponential function f(x)=a^x and its derivative f'(x)=a^x·ln a, where a is an input value by the user. Display the values of f(x) and f'(x), and use an auxiliary function g to quantify the difference between the two functions. Adjust the value of a to observe the gap between f(x) and f'(x), and find the value of a that minimizes the gap, revealing the special role of the natural logarithm base e.
The prompt above was compiled from the original drawing commands and is for reference only.