
Mental Percentages of Quantity L3
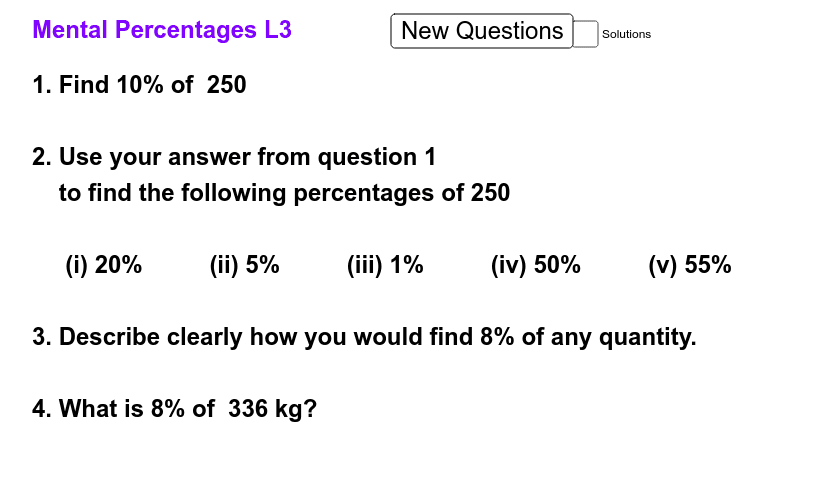
Loading the math board and drawing, please wait…
This example demonstrates how dynamic interactions help understand the impact of percentage changes on the area of shapes. Core math concepts include percentage calculations, area computation, geometric transformations, and coordinate geometry. It uses commands like Random, interactive buttons (button1), variables (a,b,c,d), calculation objects (sol1,s), and text elements (text series) for visualization. Suitable for high school students to visualize and think about the relationship between percentages and geometric figures.
GeoGebra Commands & Parameters
Random(50, 1000) → bRandom(1, 100) → cRandom(50, 1000) → dRandom(50, 100) → n
AI Drawing Prompt Reference
Create a dynamic visualization showing the impact of percentage changes on the area of shapes. Randomly generate a value between 50 and 1000 as the base area, and another between 1 and 100 as a percentage. Use a button to control scaling the base area by this percentage, displaying the original area, percentage, and new area as text. Include coordinate axes and the transformed shape to illustrate the relationship between percentages and geometric area.
The prompt above was compiled from the original drawing commands and is for reference only.