
Visual Percentage Demonstration
Loading the math board and drawing, please wait…
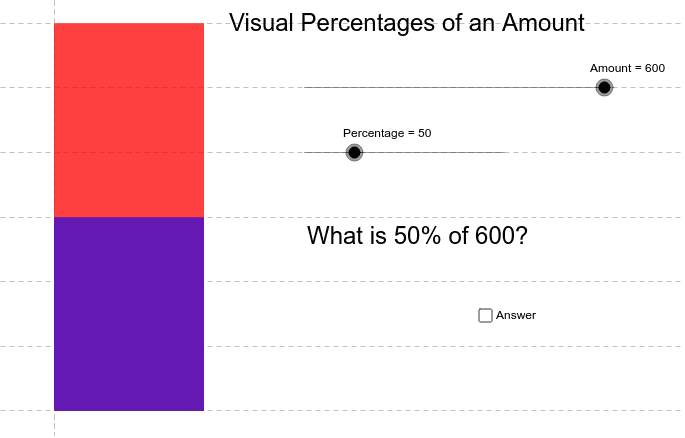
This example demonstrates percentage calculations and visualizations through dynamic geometric figures. It involves core mathematical concepts like percentage computation, geometric construction, and equation solving. Key GeoGebra commands used include Polygon, with objects like Amount, Percentage, A, B, C, D, poly1, poly2, etc. Suitable for high school mathematics education to enhance understanding of the relationship between percentages and geometric shapes.
GeoGebra Commands & Parameters
Polygon(A, B, C, D) → poly1, a, b, c, dPolygon(E, F, H, G) → poly2, e, f, h, g
AI Drawing Prompt Reference
Draw a graphic composed of four points representing amounts, percentages, and geometric shapes. The graphic should illustrate the relationship between these elements through dynamic construction, emphasizing the concept of percentage calculation. Ensure the graphic is clear to help understand the connection between percentages and geometric shapes.
The prompt above was compiled from the original drawing commands and is for reference only.