
Integral Area from Graph Demo
Loading the math board and drawing, please wait…
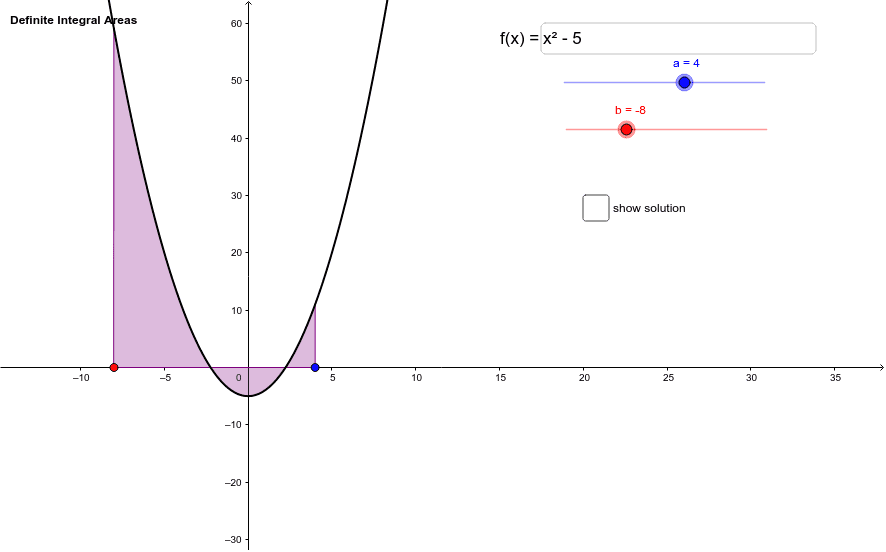
This example demonstrates how to calculate the integral area under a function graph using GeoGebra. It involves core math concepts like integration, derivatives, function graphing, and curve sketching. Key GeoGebra commands and objects used include Textfield, Segment, Root, IntegralBetween, and Integral. Suitable for high school students and educators for calculus instruction and function graph analysis.
GeoGebra Commands & Parameters
Textfield(f) → inputBox3Segment(P1_1, P1) → dSegment(P2, P2_1) → eRoot(f) → A, B, C, DIntegralBetween(f, -(x(c) / y(c)) * x - z(c) / y(c), b, a) → Area1Integral(f) → g
AI Drawing Prompt Reference
Draw a function graph and demonstrate how to calculate its integral area. First, plot the function curve, then mark several key points on the curve and draw line segments connecting them. Next, shade the area under the function graph to represent the integral, using different colors or patterns. Finally, add text annotations to explain the relationship between integration, derivatives, and function graphs, suitable for high school calculus instruction.
The prompt above was compiled from the original drawing commands and is for reference only.