
Median Calculation and Geometric Construction Example
Loading the math board and drawing, please wait…
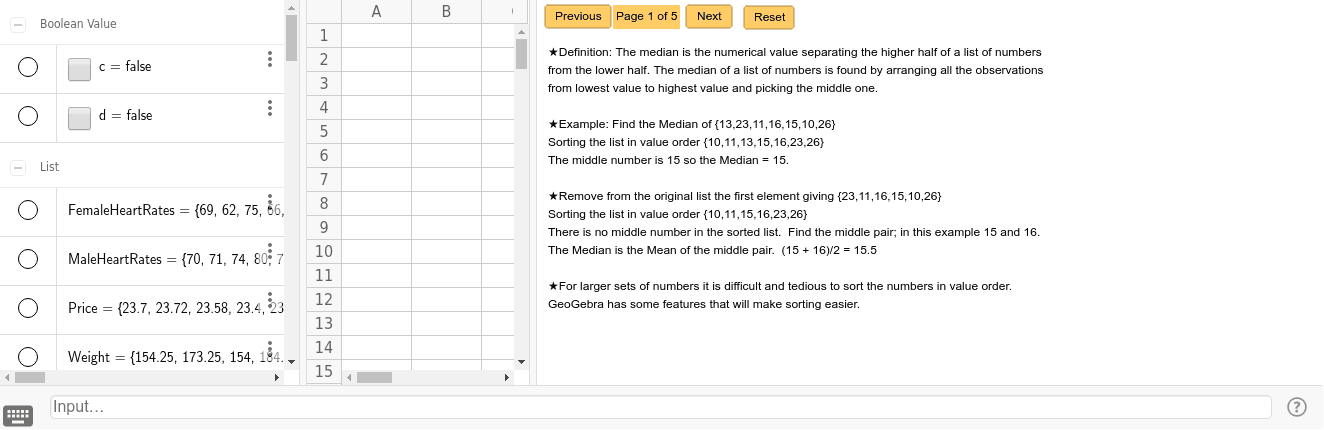
This example demonstrates median calculation using small data sets, suitable for beginners in statistics. Key mathematical concepts include median definition, data sorting, and position determination. Construction involves GeoGebra commands like n, button1, max, etc. for data visualization. Suitable for middle school students or high school students learning statistics.
GeoGebra Commands & Parameters
Numeric n(1.0)Numeric max(5.0)Numeric F1(23.7)Numeric F2(23.72)Numeric F3(23.58)Numeric F4(23.4)Numeric F5(23.38)Numeric F6(23.63)Numeric F7(23.6)Numeric F8(23.6)Numeric F9(23.63)Numeric F10(23.78)Numeric F11(23.7)Numeric F12(23.65)Numeric F13(23.51)Numeric F14(23.69)Numeric F15(23.51)Numeric F16(23.3)Numeric F17(22.92)Numeric F18(23.09)Numeric F19(23.47)Numeric F20(23.71)Numeric F21(23.65)Numeric F22(23.88)Numeric F23(23.9)Numeric F24(24.13)Numeric F25(24.25)Numeric F26(24.31)Numeric F27(24.3)Numeric F28(24.28)Numeric F29(24.4)Numeric F30(24.41)Numeric F31(24.32)Numeric F32(24.29)Numeric F33(24.26)Numeric F34(24.22)Numeric F35(24.2)Numeric F36(24.19)Numeric F37(24.15)Numeric F38(24.2)Numeric F39(24.38)Numeric F40(24.41)Numeric F41(24.45)Numeric F42(24.38)Numeric F43(24.43)Numeric F44(24.42)Numeric F45(24.45)Numeric F46(24.4)Numeric F47(24.45)Numeric F48(24.4)Numeric F49(24.33)Numeric F50(24.34)Numeric F51(24.36)Numeric F52(24.26)Numeric F53(24.32)Numeric F54(24.27)Numeric F55(24.14)Numeric F56(24.19)Numeric F57(23.91)Numeric F58(23.86)
AI Drawing Prompt Reference
Draw a dataset with 38 points representing a set of statistics. First, sort these points by their values. Then, find the median, which is the value at the middle position when the points are sorted. If there are an even number of points, take the average of the two middle values.
The prompt above was compiled from the original drawing commands and is for reference only.