
Visual Proof of Equivalent Fractions Rule with Pie Charts and Sectors
Loading the math board and drawing, please wait…
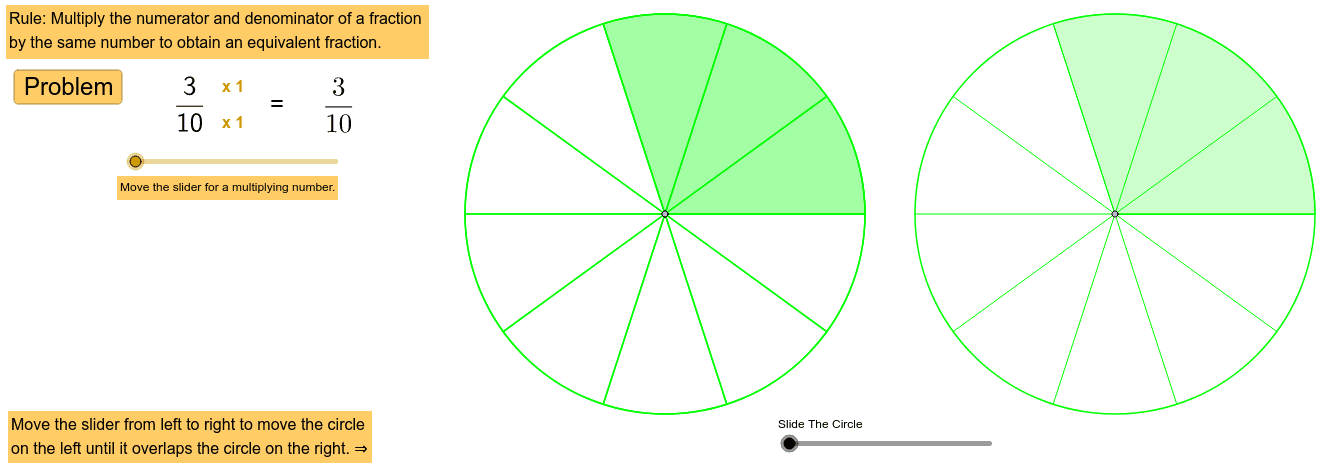
① This GeoGebra example dynamically demonstrates that two fractions (e.g., 1/2 and 2/4) occupy equal areas in pie charts, visually proving the rule of equivalent fractions. ② The core mathematical concept is fraction equivalence: multiplying or dividing numerator and denominator by the same non-zero integer preserves the value; it also uses GCD for simplification. ③ Construction details: The commands Random, GCD, Point, Segment, Circle, Sequence, Sector, Translate, and Vector are used. Random generates random fractions, GCD computes the greatest common divisor, Circle and Sector draw pie slices, Sequence creates multiple sectors, Translate and Vector enable side-by-side comparison, and interactive buttons/sliders allow changing numerator and denominator dynamically. ④ Suitable for upper elementary to middle school students learning fractions, and for teachers demonstrating equivalence visually before formal proofs, building intuition for ratios, decimals, and percentages.
GeoGebra Commands & Parameters
Random(2, 12) → denom_1Random(1, denom_1 - 1) → numer_1GCD(numer_1, denom_1) → tPoint(xAxis) → BSegment(B, A) → aPoint(a) → CCircle(C, 4) → dSequence(m, m, 1, denom - 1, 1) → list3Sequence(Segment[C, C + ((4 * cos(α°)), (4 * sin(α°)))], α, 0, 360, 360 / denom) → list2Sector(d, 0, ((numer * 360) * ° / denom)) → eRandom(2, ceil(24 / denom)) → multTranslate(d, Vector[B, (f, 0)]) → d'_1Vector(B, (f, 0)) → uTranslate(e, u) → e'Translate(list2, u) → list2'Sequence(Segment[A, A + ((4 * cos(α°)), (4 * sin(α°)))], α, 0, 360, 360 / ((g * denom))) → list1Sector(c, 0, (((g * numer) * 360) * ° / ((g * denom)))) → e_1
AI Drawing Prompt Reference
Draw two identical pie charts side by side on a horizontal line. The left chart is divided into equal sectors, with one highlighted sector filled in a distinct color. The right chart is divided into more sectors, but the highlighted area has the same total size as the left one, demonstrating equivalent fractions. Both charts have equal radius, and the right chart is a translated copy of the left. Radial lines from the center divide each circle, and the highlighted sector starts from the top and extends clockwise. Include controls to change the numerator and denominator, updating the sector divisions and filled areas dynamically.
The prompt above was compiled from the original drawing commands and is for reference only.