
Mean & Standard Deviation of Grouped Data Visualization
Loading the math board and drawing, please wait…
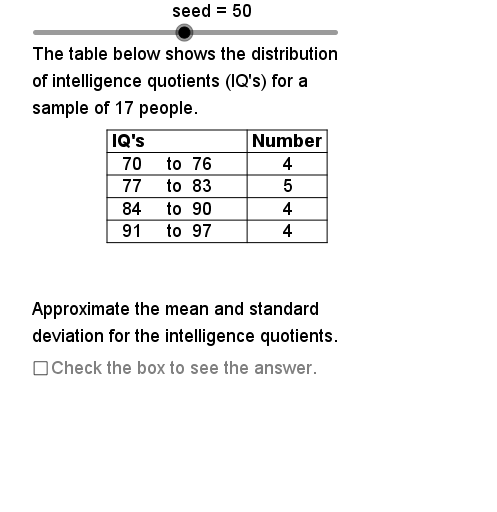
This GeoGebra example demonstrates the calculation and visualization of mean and standard deviation for grouped data. It covers core statistical concepts including frequency distribution, central tendency, and dispersion. Construction utilizes commands like Sequence, Sum, If, and Segment to build dynamic data tables and statistical measures. Ideal for high school or introductory college statistics students to explore how data grouping affects statistical outcomes.
GeoGebra Commands & Parameters
Element(DtSq, DataSet) → Dt0Sequence(Element[Dt0, Mod[Strt + (k * Rate), 20] + 1], k, 1, Size) → Smp1Max(Smp1) → DtMxMin(Smp1) → DtMnElement(AcSq, DataSet) → Ac0If(CW > CWUB, NmbCls1 - 1, NmbCls1) → NmbCls2Sequence(DtMn + (k * CW), k, 0, NmbCls2 - 1) → LCLSqSequence(UCL0 + (k * CW), k, 0, NmbCls2 - 1) → UCLSqSequence("to", k, 1, NmbCls2) → ToSqSequence(CountIf[Element[LCLSq, k] ≤ x ≤ Element[UCLSq, k], Smp1], k, 1, NmbCls2) → FrqSqSum(FrqSq) → ChkSzSequence((Element[LCLSq, k] + Element[UCLSq, k]) / 2, k, 1, NmbCls2) → MdPtsSegment(TbUL, TbUR) → tbtpSegment(TbUL, TbLL) → tblfSegment(TbUR, TbLR) → tbrtSegment(TbUM, TbLM) → tbvmSequence((Element[MdPts, k] * Element[FrqSq, k]), k, 1, NmbCls2) → XFSqSequence((Element[MdPts, k]^(2) * Element[FrqSq, k]), k, 1, NmbCls2) → XsqFSqSum(XsqFSq) → XsqFSumSum(XFSq) → XFSumElement(DDSq, DataSet) → DDElement(ClsLbSq, DataSet) → ClassElement(StObSq, DataSet) → StatObjElement(UntSq, DataSet) → UnitSequence(Segment[(TbLf, TbTp - (TbRwHt * k)), (TbRt, TbTp - (TbRwHt * k))], k, 1, NmbCls2 + 1) → TbHLnSequence(Text[Element[MdPts, k], (0.6, TbTp - 0.35 - (k * TbRwHt))], k, 1, NmbCls2) → MdPtTxSequence(Text[Element[LCLSq, k], (2, TbTp - 0.35 - (k * TbRwHt))], k, 1, NmbCls2) → LCLTxtSequence(Text[Element[FrqSq, k], (5.2, TbTp - 0.35 - (k * TbRwHt))], k, 1, NmbCls2) → FrqSqTxSequence(Text[Element[UCLSq, k], (3.4, TbTp - 0.35 - (k * TbRwHt))], k, 1, NmbCls2) → UCLSqTxSequence(Text[Element[ToSq, k], (2.9, TbTp - 0.35 - (k * TbRwHt))], k, 1, NmbCls2) → ToSqTx
AI Drawing Prompt Reference
Create a statistical chart to visualize the mean and standard deviation of grouped data. Start by constructing a data table with data points, class intervals, and frequencies. Calculate the midpoint, frequency, and midpoint times frequency for each interval. Then draw a histogram where each bar represents a class interval with height equal to its frequency. Finally, label the midpoints and frequencies below the chart for clear data representation.
The prompt above was compiled from the original drawing commands and is for reference only.