
Matha'art: Trigonometric Curves
Loading the math board and drawing, please wait…
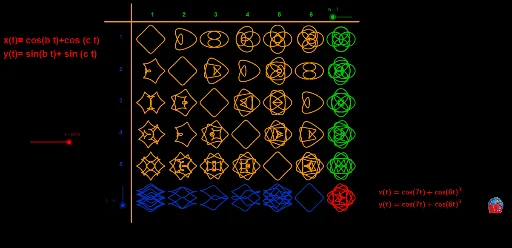
This example demonstrates how to create aesthetically pleasing parametric curves using trigonometric functions. Key math concepts include parametric equations, trigonometry, and coordinate geometry. Construction highlights involve using commands like CurveCartesian for Cartesian curves, TableText and Sequence for data tables, and Segment for line segments, along with variables A, B, b, c, a, C, etc. Suitable for high school and above, focusing on understanding parametric equations and function graphing techniques.
GeoGebra Commands & Parameters
CurveCartesian(x(A) + cos((b * t)) + cos((c * t))^(3), y(A) + sin((b * t)) + sin((c * t))^(3), t, 0, 6.28319) → aTableText({{"x(t)=cos(" + (If[b > 1, "" + b, ""]) + "t)+cos(" + (If[c > 1, "" + c, ""]) + "t)³"}, {"y(t)=cos(" + (If[b > 1, "" + b, ""]) + "t)+cos(" + (If[c > 1, "" + c, ""]) + "t)³"}}, "l") → texte2Sequence(Text[i, A + ((4.5 * i), 3.25)], i, 1, 6) → liste9Segment(A - (2, -2.5), A + (34, 2.5)) → eSequence(Text[i, A + (0, 4.5 - (4.5 * i))], i, 1, 5) → liste10Segment(A + (1.75, 5), A + (1.75, -26)) → fSequence(CurveCartesian[x(A) + (4.5 * j) + cos((j * i)) + cos(i)^(3), y(A) + sin((j * i)) + sin(i)^(3), i, 0, t], j, 1, 6) → liste1Sequence(CurveCartesian[x(A) + (4.5 * j) + cos((j * i)) + cos((2 * i))^(3), y(A) - 4.5 + sin((j * i)) + sin((2 * i))^(3), i, 0, t], j, 1, 6) → liste2Sequence(CurveCartesian[x(A) + (4.5 * j) + cos((j * i)) + cos((3 * i))^(3), y(A) - 9 + sin((j * i)) + sin((3 * i))^(3), i, 0, t], j, 1, 6) → liste3Sequence(CurveCartesian[x(A) + (4.5 * j) + cos((j * i)) + cos((4 * i))^(3), y(A) - 13.5 + sin((j * i)) + sin((4 * i))^(3), i, 0, t], j, 1, 6) → liste4Sequence(CurveCartesian[x(A) + (4.5 * j) + cos((j * i)) + cos((5 * i))^(3), y(A) - 18 + sin((j * i)) + sin((5 * i))^(3), i, 0, t], j, 1, 6) → liste5Sequence(CurveCartesian[x(A) + 31.5 + cos((b * i)) + cos((j * i))^(3), y(A) + 4.5 - (4.5 * j) + sin((b * i)) + sin((j * i))^(3), i, 0, t], j, 1, 5) → liste7Sequence(CurveCartesian[x(A) + (4.5 * j) + cos((c * i)) + cos((6 * i))^(3), y(A) - 22.5 + sin((j * i)) + sin((c * i))^(3), i, 0, t], j, 1, 6) → liste8CurveCartesian(x(C) + cos((b * i)) + cos((c * i))^(3), y(C) + sin((b * i)) + sin((c * i))^(3), i, 0, t) → d
AI Drawing Prompt Reference
Create a grid of parametric curves generated by trigonometric functions. Starting near the origin, arrange six groups horizontally, each with a main curve and five variations, forming symmetric wave patterns. Stack five groups vertically, each with six curves, creating a rectangular array. To the right, draw a single large curve, and below, another curve. All curves use combinations of cosine and sine powers, resembling petals or spirals. Add coordinate axes with tick labels, boundary segments, and numeric labels near intersections.
The prompt above was compiled from the original drawing commands and is for reference only.