
Match Functions with Their Derivatives
Loading the math board and drawing, please wait…
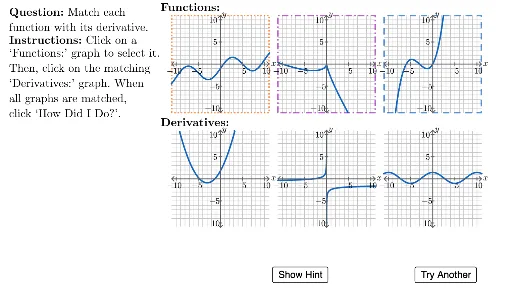
This example demonstrates how to match a function graph with its derivative graph. The core math concepts involved include functions, derivatives, and graph recognition. Key GeoGebra commands/objects used in the construction include Zip, Random, Flatten, NumberListToLatex, Shuffle, Polygon, Join, If, LaTeX, Translate, UnicodeToLetter, Sequence, Element, Derivative, and Intersect. It is suitable for high school students learning calculus to understand the relationship between functions and their derivatives.
GeoGebra Commands & Parameters
Zip(Rotate[{Segment[(11, 0), (10.5, 0.5)], Segment[(11, 0), (10.5, -0.5)]}, A, (0, 0)], A, {0, 90°, 180°, 270°}) → TemplateAxisArrowsRandom(-5, 5) → t3var2Random(3, 10) → t3var1Flatten({Zip[x(A), A, {Intersect[t3Derivative1, 0, -10, t3var2]}], Zip[x(A), A, {Intersect[t3Derivative2, 0, t3var2Negative, 10]}]}) → t3zerosRandom(-9, -5) → t22y1Random(t22y1 + 2, t22y1 + 5) → t22y3Random(t22y3 + 1, 9) → t22y4Random(t22y3 + 2, t22y3 + 4) → t22y2Random(t22x1 + 2, t22x1 + 5) → t22x2Random(t22x2 + 2, Min[8, 8 - t22x2]) → t22x3Random(-4, 4) → a2Zip(Derivative[A], A, t2Funcs) → t2DerivativesZip(round(x(A), 1), A, {Intersect[Element[t2Derivatives, 1], 0, -11, 11]}) → t21zerosNumberListToLatex(t21zeros) → t21zerosTXTRandom(1, 2) → t2IndxRandom(a2 + 1, a2 + 4) → a3Random(-8, -2) → c2Random(c2 + 1, c2 + 3) → c3Random(c3 + 1, c3 + 3) → c4Random(c4 + 1, c4 + 3) → c5Random(-8, 0) → b2Random(b2 + 1, b2 + 4) → b3Random(b3 + 1, b3 + 4) → b4Shuffle({1, 2, 3}) → questionOrderFlatten(Sequence[Sequence[(i, j), i, -15, -15 + (2 * 24), 24], j, 10, 10 - 26, -26]) → transVectorsPolygon({(-11, -11), (-11, 11), (11, 11), (11, -11)}) → polygonTemplateShuffle({-1, 2, -2, 1}) → t1aValsShuffle({2, 3, 4, 5, 6, -2, -3, -4, -5, -6}) → t1hValsShuffle({2, 3, 4, 5, 6, -2, -3, -4, -5, -6}) → t1kValsRandom(1, 4) → caseNumJoin({Zip[Element[transVectors, A], A, questionOrder], Zip[Element[transVectors, B], B, matchOrder]}) → displayOrderIf(Random[0, 1] ≟ 1, 1, -1) → aIf(Random[0, 1] ≟ 1, 1, -1) → bLaTeX((((("\text{\textbf{Question: }" * QUESTION) * "\\\textbf{Instructions: }") * INSTRUCTIONS) * "}")) → allInstrucTranslate(polygonTemplate, Vector[Element[displayOrder, 1]]) → graph1Translate(polygonTemplate, Vector[Element[displayOrder, 2]]) → graph2Translate(polygonTemplate, Vector[Element[displayOrder, 3]]) → graph3Translate(polygonTemplate, Vector[Element[displayOrder, 4]]) → graph4UnicodeToLetter(10003) → cmarkUnicodeToLetter(10007) → xmarkTranslate(polygonTemplate, Vector[Element[displayOrder, 5]]) → graph5Translate(polygonTemplate, Vector[Element[displayOrder, 6]]) → graph6Shuffle({-2, -3, -4, -6}) → r1ValsJoin({Sequence[Segment[(-11, i), (11, i)], i, -10, 10], Sequence[Segment[(i, -11), (i, 11)], i, -10, 10]}) → TemplateGridShuffle({1, 2, 3, 4, 5, 6}) → r2ValsTranslate(polygonTemplate, Vector[Element[displayOrder, graphChosen]]) → highlightQuestionSequence(i + 3 ≟ Element[matches, i], i, 1, 3) → correctMatchesTranslate(polygonTemplate, Element[displayOrder, 1]) → q1BoxTranslate(polygonTemplate, Element[displayOrder, 2]) → q2BoxTranslate(polygonTemplate, Element[displayOrder, 3]) → q3BoxTranslate(polygonTemplate, Element[displayOrder, Element[matches, 3]]) → q3MatchingBoxTranslate(polygonTemplate, Element[displayOrder, Element[matches, 2]]) → q2MatchingBoxTranslate(polygonTemplate, Element[displayOrder, Element[matches, 1]]) → q1MatchingBoxRandom(c2 + 1, c2 + 4) → d2Random(1, 3) → t1IndxElement(t2Funcs, t2Indx) → t2FuncDerivative(t2Func) → t2DerivativeIntersect(t3Base, (t3multiplier * 11), t3var2 + 0.1, 11) → t3RightBoundaryZip(Derivative[A], A, t1Funcs) → t1DerivativesJoin({t1Funcs, t1Derivatives}) → t1AllFuncsZip(Sort[{Intersect[A, polygonTemplate]}], A, t1AllFuncs) → t1endPointsZip(If[x > x(Element[B, 1]) ∧ x < x(Element[B, 2]), C(x)], B, t1endPoints, C, t1AllFuncs) → t1FuncsRestrictedElement(t1FuncsRestricted, t1Indx) → t1FuncElement(t1FuncsRestricted, t1Indx + 3) → t1DerivativeRandom(1, 2) → t3IndxIf(t3Indx ≟ 1, t3Restricted1, t3Restricted2) → t3FuncIf(t3Indx ≟ 1, t3Derivative1, t3Derivative2) → t3DerivativeZip(Translate[A, Vector[D]], A, {t1Func, t2Func, t3Func}, D, displayOrder) → funcSegmentsRow1Zip(Translate[A, Vector[D]], A, {t1Derivative, t2Derivative, t3Derivative}, D, Take[displayOrder, 4]) → funcSegmentsRow2Zip(Translate[TemplateGrid, Vector[A]], A, Take[transVectors, 1, 3]) → allGridsRow1Zip({Roots[A, -10, 10]}, A, t1Derivatives) → t1zerosLaTeX(If[Length[t21zeros] > 0 ∧ Defined[Element[t21zeros, 1]], fbt21WithZeros, fbt21NoZeros]) → fbt21If(t1Indx ≟ 1, fbt11, If[t1Indx ≟ 2, fbt12, fbt13]) → fbt1If(t2Indx ≟ 1, fbt21, fbt22) → fbt2If(t3Indx ≟ 1, fbt31, fbt32) → fbt3Translate(Flatten[Zip[{(x(A), Slope[Line[A, B]]), (x(B), Slope[Line[A, B]])}, A, t22Points, B, Take[t22Points, 2]]], Element[displayOrder, 5]) → t22DerivativeEndPointsJoin({TemplateAxisArrows, {Zip[Segment[(A, -0.3), (A, 0.3)], A, {-10, -5, 5, 10}], Zip[Segment[(0.3, B), (-0.3, B)], B, {10, 5, -5, -10}], {Segment[(-11, 0), (11, 0)], Segment[(0, -11), (0, 11)]}}}) → TemplateAxisZip(Translate[TemplateGrid, Vector[A]], A, Take[transVectors, 4, 6]) → allGridsRow2Zip(Translate[TemplateAxis, Vector[A]], A, Take[transVectors, 1, 3]) → allAxesRow1Zip(Translate[TemplateAxis, Vector[A]], A, Take[transVectors, 4, 6]) → allAxesRow2Zip(Zip[Text[A, B + V, true, true], A, {"-10", "-5", "5", "10", "x", "-10", "-5", "5", "10", "y"}, B, TemplateTxtLocations], V, Take[transVectors, 4, 6]) → allAxisLabelsRow2Zip(Zip[Text[A, B + V, true, true], A, {"-10", "-5", "5", "10", "x", "-10", "-5", "5", "10", "y"}, B, TemplateTxtLocations], V, Take[transVectors, 1, 3]) → allAxisLabelsRow1Zip(Text[A, (2, 14.5) + V, true, true], A, graphTitles, V, transVectors) → allTitlesLaTeX(("\text{\textbf{Feedback: } (A checkmark in a column indicates a correct match.)\\" * If[IndexOf[fbIndx, questionOrder] ≟ 1, fbt1, If[IndexOf[fbIndx, questionOrder] ≟ 2, fbt2, fbt3]])) → fbDisplayZip(Text[If[A, "", ("" * xmark)], V + (7.5, 14.2), true, true], A, correctMatches, V, displayOrder) → xMarksZip(Text[If[A, ("" * cmark)], V + (7.5, 14.2), true, true], A, correctMatches, V, displayOrder) → checkMarks
AI Drawing Prompt Reference
Create a visual representation showing the relationship between functions and their derivatives. Start by plotting a coordinate axis, then generate several random functions along with their derivatives on the same axis. Label the zeros of both the functions and their derivatives. Combine these graphs and zero points into a matching game where users identify which graphs correspond to the same function and its derivative. Arrange all elements in a grid, highlighting one function and its derivative for comparison and matching.
The prompt above was compiled from the original drawing commands and is for reference only.