
Marginal Frequency Table Demo
Loading the math board and drawing, please wait…
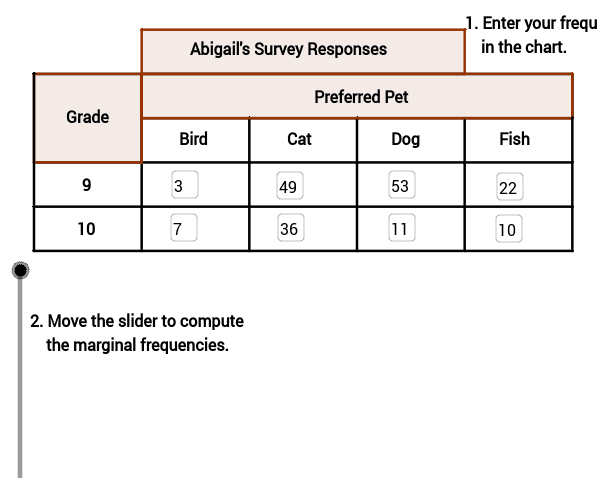
① This example shows how to build and display a two‑way frequency table with marginal totals in GeoGebra, making row, column, and grand totals immediately visible. ② Core mathematical concepts include frequency distribution, marginal distribution, and basic statistical summarisation. ③ Construction highlights: Textfield creates editable text boxes, Segment draws separating lines, Polygon forms the grid cells; objects such as A2, A3, A4, A5, B1, B2, C2, D2, E2, B3, B4, C3, D3, E3, C4, D4, E4, B5, C5, D5, E5 label the cells, while bird9, bird10, cat9, cat10, dog9, dog10, fish9, fish10 store counts, and SumFishB, Grade, Grade9, Grade10, Total, Bird, Cat, Dog, Fish, PreferredPet, A provide automatic summation. ④ Suitable for middle‑school/high‑school statistics lessons, introductory data‑analysis courses, and teacher preparation demonstrations.
GeoGebra Commands & Parameters
Textfield(B3) → bird9Textfield(B4) → bird10Textfield(C3) → cat9Textfield(C4) → cat10Textfield(D3) → dog9Textfield(D4) → dog10Textfield(E3) → fish9Textfield(E4) → fish10Segment(C, D) → bSegment(E, F) → cSegment(G, H) → dSegment(I, J) → eSegment(A, M) → gSegment(N, K) → hSegment(M, K) → iSegment(O, P) → jSegment(Q, R) → kSegment(S, T) → lSegment(B, L) → mPolygon(C, N, K, M) → poly1, n, p, q, rPolygon(C, U, O, A) → GradePoly, s, t, a_1, b_1Segment(A, S) → aSegment(K, T) → fPolygon(S, B, V, D) → poly2, s_1, b_2, v, d_1Polygon(F, A1, W, H) → poly3, f_1, a1, w, h_1Polygon(Z, L, T, J) → poly4, z, l_1, t_1, j_1Polygon(I_1, J_1, K_1, L_1) → Title, i_1, j_2, k_1, l_2
AI Drawing Prompt Reference
Create a two-way frequency table with marginal totals, using text boxes for counts, lines for grid separation, and polygons for cells. Ensure row, column, and grand totals are clearly visible, suitable for statistical teaching.
The prompt above was compiled from the original drawing commands and is for reference only.