
Mapping Diagram of Derivatives
Loading the math board and drawing, please wait…
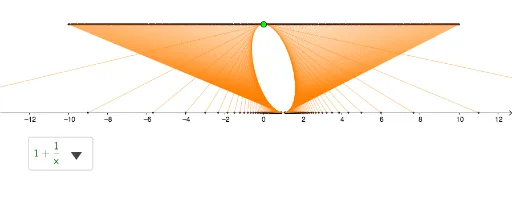
This example demonstrates the mapping diagram of derivatives, focusing on the core concept of derivatives. Using GeoGebra commands such as SelectedElement, Point, and Sequence, a clear mapping diagram of derivatives is constructed. Suitable for high school mathematics education, it helps students understand the geometric meaning of derivatives.
GeoGebra Commands & Parameters
SelectedElement(L_4) → fPoint(yAxis) → ASequence((a, y(A)), a, -10, 10, 0.05) → L_1Sequence((f(a), 0), a, -10, 10, 0.05) → L_2Sequence(Segment[(a, y(A)), (f(a), 0)], a, -10, 10, 0.05) → L_3
AI Drawing Prompt Reference
Create a mapping diagram for derivatives. Draw a function curve on a coordinate plane, and place a reference point on the y-axis. Then, generate a series of x-coordinates from -10 to 10 with a step of 0.05)Skip, and for each x, find the corresponding y-value on the curve. Next, mark points on the x-axis with the same x-coordinates and y=0. Finally, draw line segments from each x-axis point to its corresponding curve point, illustrating the mapping from the x-axis to the curve and showing how the derivative changes.
The prompt above was compiled from the original drawing commands and is for reference only.