
Maclaurin Series for the Cosine Function
Loading the math board and drawing, please wait…
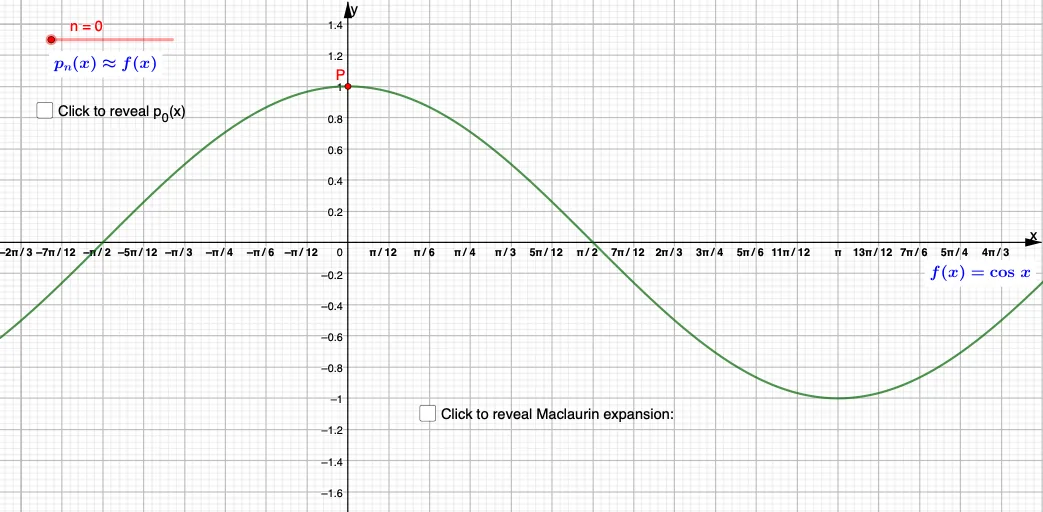
This GeoGebra example demonstrates the Maclaurin series approximation of the cosine function cos(x), showing how successive polynomial terms converge to the original curve near the origin. Core mathematical concepts include Taylor and Maclaurin series, trigonometric functions, polynomial approximation, convergence, and real-valued function graphing. The construction relies on GeoGebra's Point command to generate points P_0 through P_{10}, together with function f and text labels text1 through text14 to display each approximation stage and its coefficients; objects A, a, and b control parameters such as expansion order and viewing window. It is suitable for high school advanced mathematics and university calculus courses, ideal for teaching power series expansion, function approximation, and numerical analysis visualization.
GeoGebra Commands & Parameters
Point(P_1) → BPoint(P_2) → CPoint(P_3) → DPoint(P_4) → EPoint(P_5) → F
AI Drawing Prompt Reference
Create a coordinate-plane visualization of the Maclaurin series approximation for the cosine function near the origin. Start by showing a sequence of sampling points along the x direction beginning at the origin, using the first five successive points to represent the approximation stages. Plot these points on the same graph to indicate how different polynomial orders contribute to the cosine approximation. Then depict the overall curve trend so the successive approximations approach the original cosine shape around the origin, with a clear view of the axes to observe the convergence behavior.
The prompt above was compiled from the original drawing commands and is for reference only.