
Lotka–Volterra Predation Model: Slope Field and Phase-Plot from Numerical ODE So
Loading the math board and drawing, please wait…
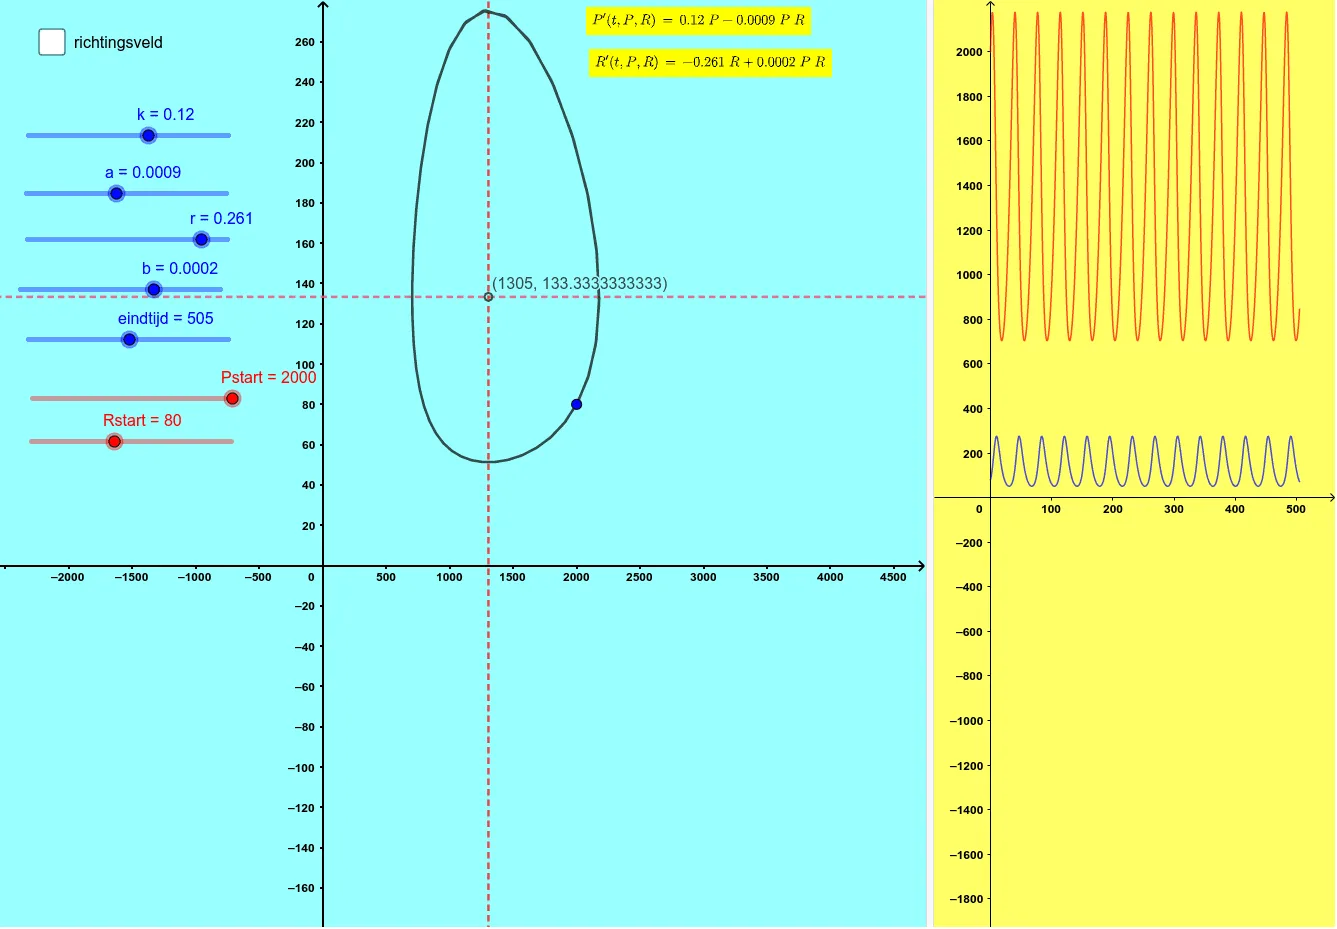
This example demonstrates how the Lotka–Volterra predator–prey system evolves over time by combining a slope field (direction field) with a phase plot. You can see local solution tendencies from the slope field and then observe the global orbit structure in the phase plane. The key mathematics includes modeling with ordinary differential equations, solving ODEs numerically, constructing direction fields, and interpreting phase trajectories. In GeoGebra, construction relies on NSolveODE, SolveODE, and LaTeX to define and compute solutions, SlopeField to generate the direction field, and faseplot to plot the resulting phase portrait. Parameters (e.g., k, a, b, r, dt, and other constants) and initial conditions (Pstart, Rstart) drive the dynamics. Supporting objects such as numeriekeIntegraal1/2, richtingsveld (vector/direction field), and auxiliary functions like f and vgl1 are used to visualize the model and annotate outcomes (tekst1/tekst2). Suitable for advanced high school through undergraduate study in calculus and differential equations, especially for topics like numerical integration, dynamical systems, and population modeling.
GeoGebra Commands & Parameters
NSolveODE({P', R'}, 0, {Pstart, Rstart}, eindtijd) → numeriekeIntegraal1, numeriekeIntegraal2SlopeField(a_{1}) → richtingsveldSolveODE(((-r) * y) + ((b * x) * y), (k * x) - ((a * x) * y), Pstart, Rstart, eindtijd, dt) → faseplotLaTeX(P', true, true) → tekst1LaTeX(R', true, true) → tekst2
AI Drawing Prompt Reference
Create a combined phase portrait and slope-field visualization for the Lotka–Volterra predator–prey ODE system. Use the coupled differential equations for prey and predator populations with given parameters and initial conditions (Pstart, Rstart), and compute the numerical solution up to the specified end time. Plot a direction (slope) field on the phase plane to show local solution tendencies at points (prey vs predator). Over it, display the corresponding phase plot showing the global orbit/trajectory structure generated by the same ODEs across the time interval. Add on-figure LaTeX-style annotations of the derivative expressions for P' and R'.
The prompt above was compiled from the original drawing commands and is for reference only.