
Function Operations and Graphing
Loading the math board and drawing, please wait…
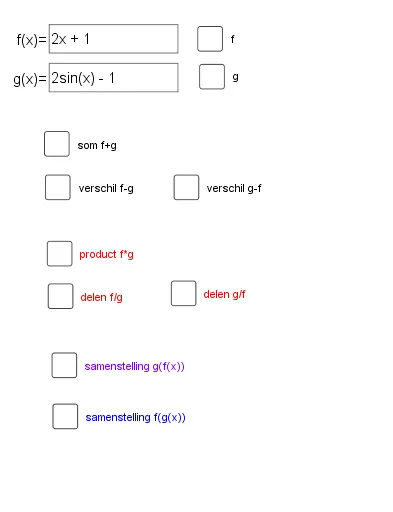
This example demonstrates the operations (+, -, *, /) of functions and their graphing. Key math concepts include function operations, function graphs, and analytical geometry. It uses GeoGebra commands/objects like Textfield, f, Invulvak1, g, Invulvak2, som, product, delen1, delen2, samen1, samen2, a, b, d, e, h, i, j, k, l, verschil1, m, verschil2, n. Suitable for high school mathematics teaching to understand the properties of function operations and the rules of graph transformations.
GeoGebra Commands & Parameters
Textfield(f) → Invulvak1Textfield(g) → Invulvak2
AI Drawing Prompt Reference
Create a coordinate system showing two editable function input fields for entering two base functions. Based on these inputs, dynamically generate and display the graphs of their sum, difference, product, and quotient, each with distinct colors or line styles. The graphs should clearly illustrate how function operations transform the original curves, such as shifts, stretches, or intersection changes. All graphs share the same axes, with key intersection points or asymptotes labeled to highlight the effects of operations.
The prompt above was compiled from the original drawing commands and is for reference only.