
Log Transform: Visualizing Logarithmic Mapping of Functions and Geometry
Loading the math board and drawing, please wait…
In collections
About Exponents
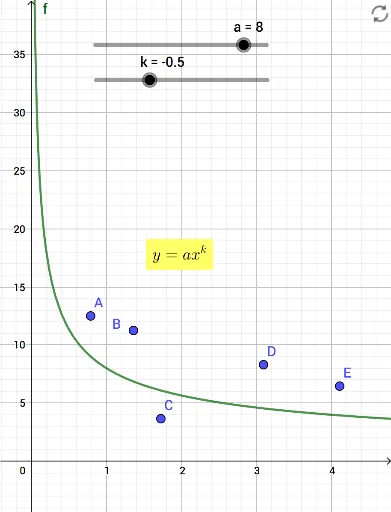
① This GeoGebra example demonstrates the log transform by showing how logarithmic mapping affects function graphs and geometric objects, making the conversion from multiplicative to additive relationships visually clear. ② Core mathematical concepts include logarithmic functions, function transformations, the inverse relationship between exponential and logarithmic functions, and the corresponding positional changes of points, segments, and triangles under the transform. ③ Construction highlights: from the summary, objects include parameters a, k, function f, original points A, B, C, D, E and their primed counterparts A', B', C', D', E' (likely obtained via logarithmic mapping), text objects text1, text2, text3 for labels, and additional objects c, m, g, b possibly representing curves or auxiliary lines. The construction leverages GeoGebra's transformation and graphing commands. ④ Suitable for high school or early college students to understand logarithmic properties, graph transformations, and the geometric meaning of coordinate mapping, and useful for classroom demonstrations.
GeoGebra Commands & Parameters
Numeric a(8)Numeric k(-0.5)f(x) = (a * x^(k))Point A(0.7888981033069175, 12.500806167761667)Point B(1.3598913624125082, 11.248827451666942)Point C(1.7253270482400864, 3.6633093482695447)Point D(3.0957108700935043, 8.302995178502904)Point E(4.112078871301456, 6.46185000777538)(log(4, x(A)), log(8, y(A)))(log(4, x(B)), log(8, y(B)))(log(4, x(C)), log(8, y(C)))(log(4, x(D)), log(8, y(D)))(log(4, x(E)), log(8, y(E)))log(a) / log(8)(k * log(4) / log(8))y = (m * x) + cBoolean b(true)
AI Drawing Prompt Reference
Create a log transform graph with parameters a and k, function f(x) = a * x^k, and points A, B, C, D, E and their log-transformed counterparts A', B', C', D', E'. First, plot the function f, then create points A, B, C, D, E, calculate their log-transformed coordinates, and finally plot the transformed points.
The prompt above was compiled from the original drawing commands and is for reference only.