
Log_e Graph with Transformations
Loading the math board and drawing, please wait…
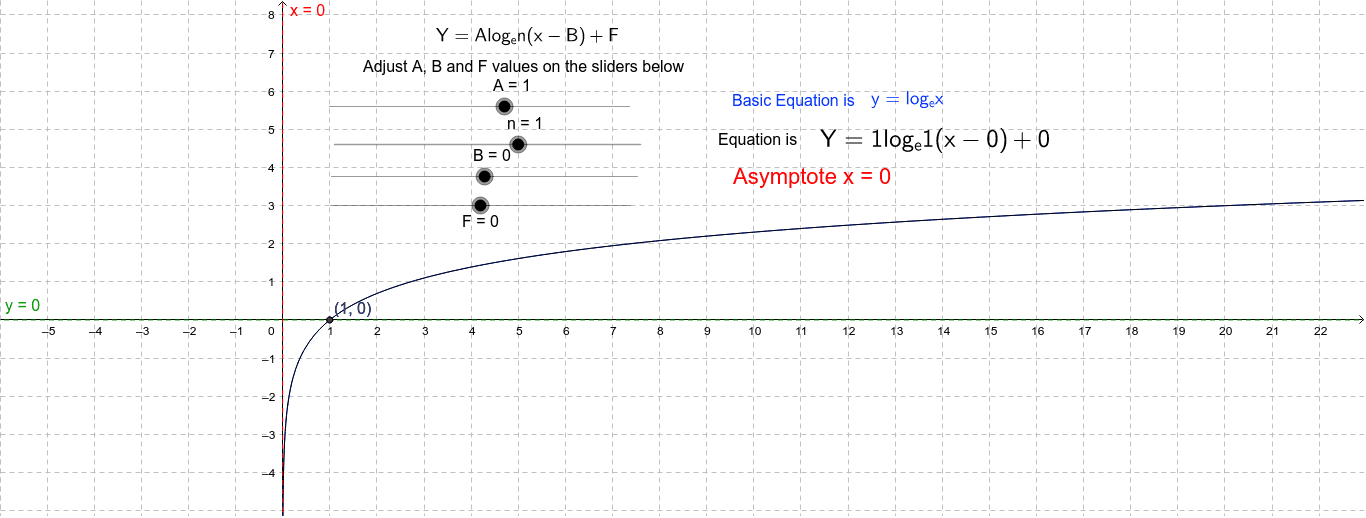
This example demonstrates the graph of the natural logarithm function and its transformations. Key mathematical concepts include logarithmic functions and graph transformations. By adjusting parameters, you can observe translations and scalings of the graph. The construction summary mentions the use of objects like Basic, a, d, n, and f, involving the drawing of function graphs. Suitable for high school mathematics education or learning.
GeoGebra Commands & Parameters
Numeric A(1.0)Point B_1(1.0, 0.0)Numeric B(0.0)Numeric F(0.0)Basic(x) = log(x)x = By = FNumeric n(1.0)f(x) = (A * log((n * (x - B)))) + F(B + 1 / n, F)
AI Drawing Prompt Reference
Draw the graph of the natural logarithm function and its transformations. Start with the basic logarithmic curve, then apply translations and scalings by adjusting parameters. Include a horizontal reference line and a vertical reference line to show shifts. The function is a scaled logarithm of a shifted and scaled input, plus a vertical offset. Mark a specific point on the curve located one unit to the right of the vertical reference line, with its y-coordinate equal to the horizontal reference line. This illustrates how the graph changes with parameters.
The prompt above was compiled from the original drawing commands and is for reference only.