
Tangent Graph with Transformations (Radians)
Loading the math board and drawing, please wait…
In collections
Strand 2: Geometry and Trigonometry
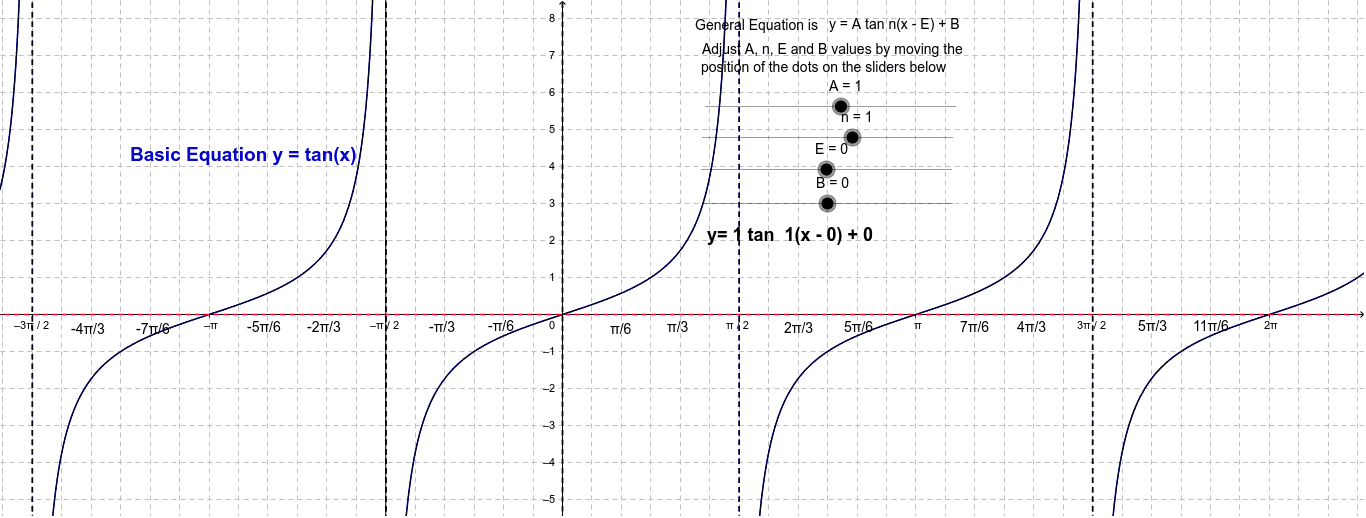
① This example demonstrates the basic graph of the tangent function y = tan(x) in radians, along with various transformations such as translations and scalings controlled by parameters. ② Core mathematical concepts include trigonometric functions (tangent), periodicity, asymptotes, and fundamental graph transformations (horizontal/vertical shifts, amplitude/period changes). ③ Construction highlights: from the construction summary, multiple points (A, B, E), sliders (n, h, d, i), and text objects (text1–text20) are used; expressions like x = E - π/n adjust period or phase, and function objects (f, c, e, g, j) plot different transformed tangent curves, providing an interactive dynamic environment. ④ Suitable for high school or pre-university trigonometry lessons, useful for classroom demonstrations or student self-exploration of function transformations.
GeoGebra Commands & Parameters
Numeric A(1.0)Numeric B(0.0)Numeric E(0.0)Numeric n(1.0)y = Bx = Ep(x) = tan(x)Line m(1.0, 0.0, -4.71238898038469)Line q(1.0, 0.0, 1.5707963267948966)Line r(1.0, 0.0, 4.71238898038469)Line s(1.0, 0.0, -1.5707963267948966)x = Ex = E - (π / 2 * n)x = E - (5 * π / ((2 * n)))x = E - (π / 2 * n)f(x) = (A * tan((n * (x - E)))) + Bx = E + π / ((2 * n))x = E - (3 * π / ((2 * n)))x = E + (3 * π / ((2 * n)))x = E + (5 * π / ((2 * n)))x = E - (7 * π / ((2 * n)))x = E + (9 * π / ((2 * n)))x = E - π / ((2 * n))x = E + (7 * π / ((2 * n)))x = E - (9 * π / ((2 * n)))x = E + (11 * π / ((2 * n)))x = E + (13 * π / ((2 * n)))x = E + (15 * π / ((2 * n)))x = E + (17 * π / ((2 * n)))x = E - (11 * π / ((2 * n)))x = E - (13 * π / ((2 * n)))
AI Drawing Prompt Reference
Draw a tangent function graph in radians with transformations. Start with the basic y = tan(x) curve, then apply vertical scaling, horizontal shift, and vertical shift using adjustable parameters. Add multiple vertical asymptotes whose positions depend on the period parameter, and include a horizontal reference line. Use different colors or line styles to distinguish the original curve from transformed ones, and mark several key points to show how shifts and scaling affect the shape.
The prompt above was compiled from the original drawing commands and is for reference only.