
Locating the Center of Dilation with GeoGebra
Loading the math board and drawing, please wait…
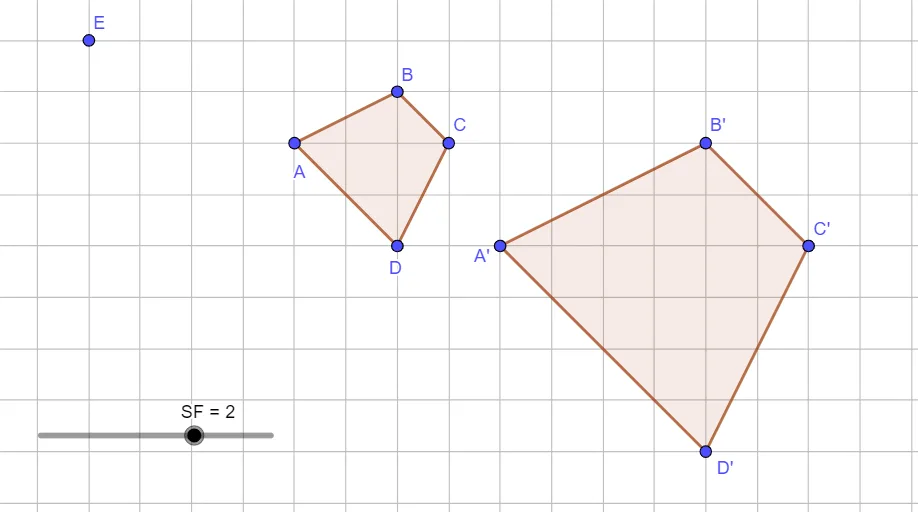
This example demonstrates how to find the center of dilation by using corresponding points from a dilation transformation. It visually highlights that under a similarity (dilation) centered at a point, the lines through each pair of corresponding points are consistent and the relevant distance relationships are preserved up to a constant scale factor. The core concepts include dilation (geometric scaling), corresponding points under transformation, and distance-ratio reasoning using Euclidean distances. Construction-wise, the diagram is built with Polygon to create the initial geometric figure, Dilate to generate the transformed points (such as A↦A′, B↦B′, C↦C′, D↦D′), and Distance to compute and check key measures (e.g., distanceEA, distanceAA′, distanceEA′) to confirm the correct dilation center. It directly uses the GeoGebra commands Polygon, Dilate, and Distance, together with objects like points A, B, C, D, E and their images A′, B′, C′, D′. Suitable for middle school through early college geometry lessons and interactive learning of geometric transformations and center-of-dilation identification.
GeoGebra Commands & Parameters
Polygon(A, B, C, D) → q1, a, b, c, dDilate(A, SF, E) → A'Dilate(B, SF, E) → B'Dilate(C, SF, E) → C'Dilate(D, SF, E) → D'Polygon(A', B', C', D') → q1', a', b', c', d'Distance(E, A) → distanceEADistance(A, A') → distanceAA'Distance(E, A') → distanceEA'
AI Drawing Prompt Reference
Draw a figure with four points, where point E is the center of dilation. Points A, B, C, D are the original points, and their dilated images A', B', C', D' are at the same scaling ratio from E. Connect original points to their images and measure distances to show the consistent scaling ratio.
The prompt above was compiled from the original drawing commands and is for reference only.