
Local Extrema via Tangent Lines: Geometric Insight
Loading the math board and drawing, please wait…
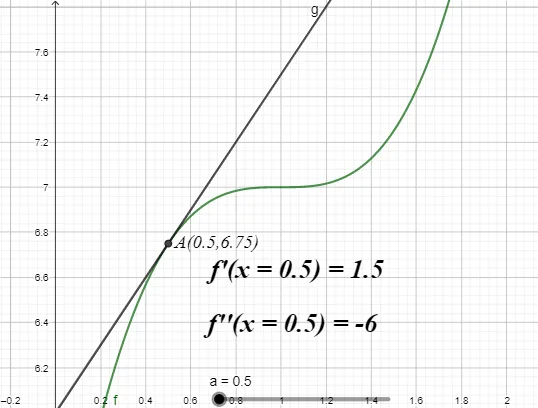
This example illustrates how local extrema of a function can be visualized by selecting key points on the graph and examining the corresponding tangent-line behavior. The geometric phenomenon is linked to the calculus idea that the derivative relates to the slope of the tangent line, helping students understand why local maxima/minima occur where the slope is zero and how tangent characteristics change around those points. Core math concepts include differential calculus, local extrema (local maximum/minimum), the geometric meaning of the derivative, and point-based reasoning using selected x-values and auxiliary reference objects. Construction-wise, the provided GeoGebra script emphasizes the commands Tangent and Text: for the function f and selected points (a, A, g, b, c), it draws tangents and uses multiple text objects (text1, text2, text3) to label the critical locations and the inferred extremum-related conclusions. Suitable for high-school (Class XII) calculus instruction, classroom demonstrations, and guided practice on derivatives and extremum interpretation.
GeoGebra Commands & Parameters
Tangent(A, f) → gText((((("A(" * a) * ",") * f(a)) * ")")) → text1Text(((("f'(x = " * a) * ") = ") * b)) → text2Text(((("f''(x = " * a) * ") = ") * c)) → text3
AI Drawing Prompt Reference
Draw a function graph, select key points, draw tangents at these points, and label the slope of the tangents, the change in slope, and the relationship between tangents and the function graph to help understand the geometric meaning of local extrema.
The prompt above was compiled from the original drawing commands and is for reference only.