
Geometric Demonstration of Lagrange Multipliers: Tangency of Level Curves and Co
Loading the math board and drawing, please wait…
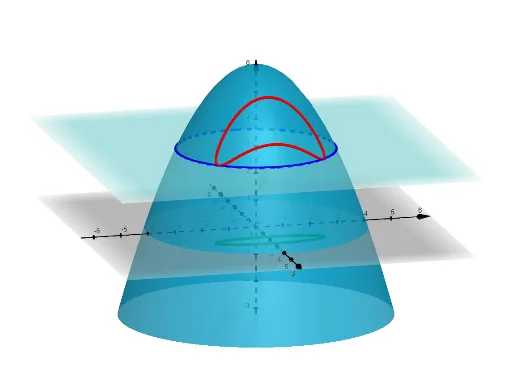
This example demonstrates the geometric principle of Lagrange multipliers: the local extreme points of a function f(x,y) subject to constraint g(x,y)=k occur at points where the level curves of f are tangent to the constraint curve. Using GeoGebra, the level curves of the objective function and the constraint curve are drawn; CurveCartesian generates the curves while IntersectPath finds their intersection points. This visualization clearly shows the relationship between the gradient direction and the normal vector of the constraint curve. Suitable for calculus and optimization courses in higher education.
GeoGebra Commands & Parameters
CurveCartesian((g(t), h(t)), t, -10, 10) → ConstraintCurveCartesian((g(t), h(t), f(g(t), h(t))), t, -10, 10) → aIntersectPath(p, f) → Trace
AI Drawing Prompt Reference
Draw the level curves of a function and a constraint curve, highlighting the points of tangency between them, which represent the local extrema of the function under the constraint. First, plot the constraint curve, then the level curves of the objective function, and finally mark the intersection points of the two curves to illustrate the relationship between the gradient direction and the normal vector of the constraint curve, suitable for calculus and optimization courses.
The prompt above was compiled from the original drawing commands and is for reference only.