
Newton's Method Visualization
Loading the math board and drawing, please wait…
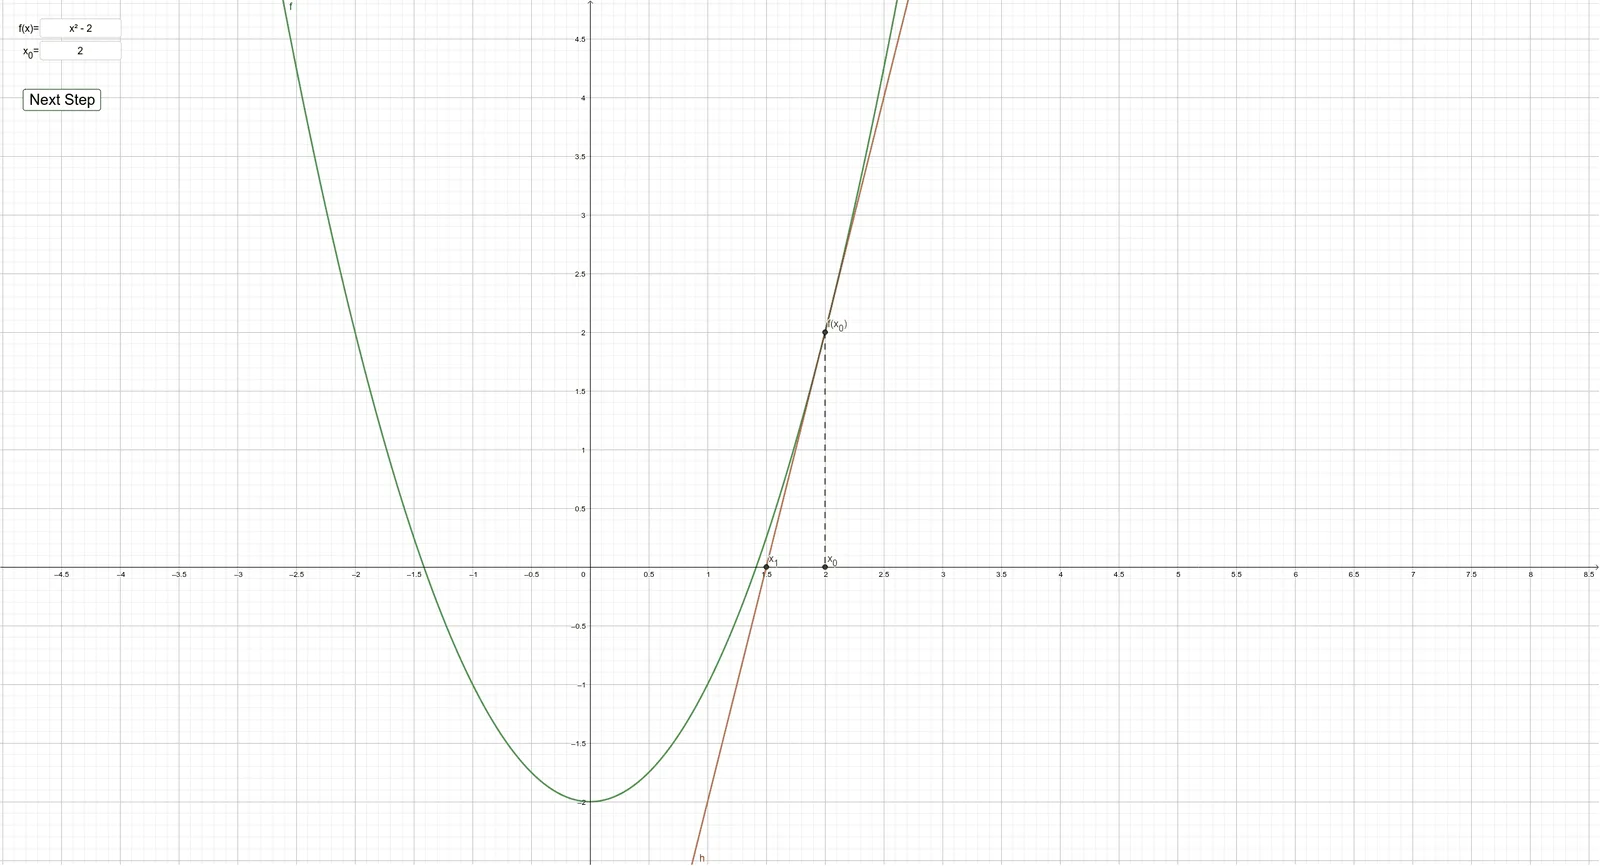
This GeoGebra example provides an interactive visualization of Newton's Method for finding roots of a function. It demonstrates the iterative tangent-line approximation: starting from an initial guess x₀, the tangent to the function at that point is drawn, and its intersection with the x-axis gives the next approximation. Core mathematical concepts include derivatives, tangent lines, function graphs, limits, and iterative convergence. The construction uses Textfield and InputBox for user inputs (initial value and iteration count), Segment to draw tangents, Intersect to find the tangent-x-axis crossing, and Text to display results. Objects include points A, B, C, function f, tangent lines g and h, button1, and text elements. Suitable for high school to college calculus courses, this tool helps learners grasp the geometric intuition behind Newton's method and observe how successive approximations converge to the root.
GeoGebra Commands & Parameters
Textfield(f) → InputBox1Segment(B, A) → gIntersect(h, xAxis, (1.5, 0)) → CTextfield(x_{0}) → InputBox2Text("x_{" + n + "}=" + ((x(A) * ""))) → text1