
Explaining Derivatives with Tangents and Geometry for Area–Perimeter Optimizatio
Loading the math board and drawing, please wait…
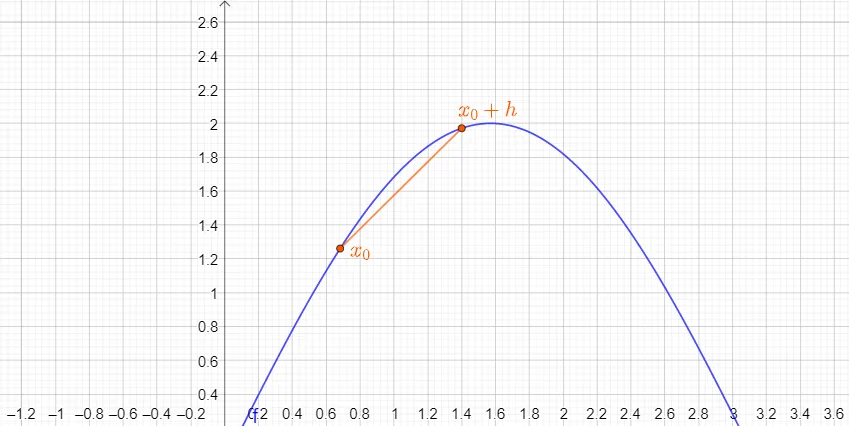
This GeoGebra example demonstrates how derivatives (via tangent slopes) can be used to interpret and solve optimization problems using geometric quantities. By constructing key points on graphs/functions and drawing tangents at selected locations, it highlights that the derivative encodes the instantaneous rate of change, which then guides the search for optimal configurations under geometric constraints. The example’s core concepts include calculus (derivative interpretation through tangents), function behavior, and optimization using area/perimeter-style measures. Construction-wise, the setup is driven by commands Point, Tangent, and Segment, creating objects such as f, g, h together with corresponding labeled points (e.g., A, B, C) and segments that form the geometric structure used for reasoning. Suitable for advanced high school through early undergraduate calculus and applications (including modeling in production economics or constrained optimization lessons).
GeoGebra Commands & Parameters
Point(f) → ATangent(A, f) → gSegment(A, B) → hPoint(f) → CSegment(A, C) → i
AI Drawing Prompt Reference
In one coordinate plane, plot a given function and choose a point on the graph as a tangency point. Draw the tangent line to the graph at that point. Then connect the tangency point to a second key point with a segment to form a geometric reference structure. Next, pick another different point on the function’s graph and draw a segment from the first key point to this new point, creating a simple configuration of tangents and segments. Emphasize the relationship between the tangent line and the function’s local rate of change at the selected locations.
The prompt above was compiled from the original drawing commands and is for reference only.