
Derivative of a Nonlinear Function: Curve, Tangent, and Segment Construction
Loading the math board and drawing, please wait…
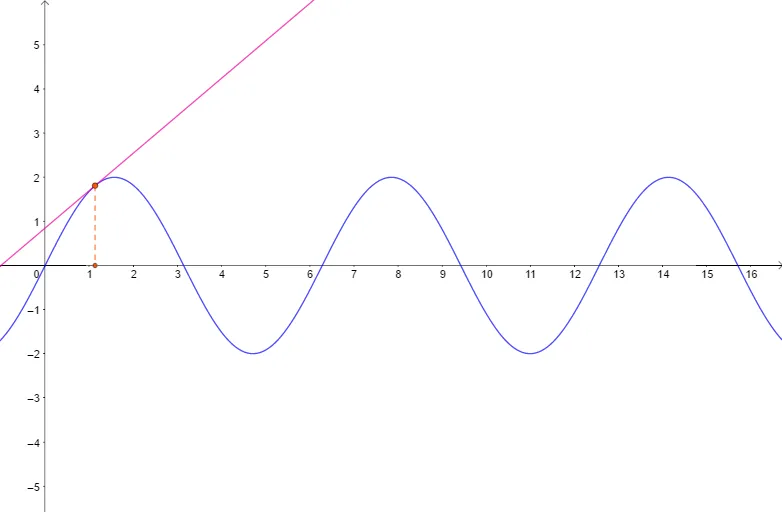
This example visualizes the geometric meaning of the derivative for a nonlinear function by constructing a curve and its tangent, emphasizing how the slope of the tangent represents the local rate of change. It highlights core calculus ideas—derivatives as tangent-line slopes, the tangency condition between a function and a tangent, and the way key points and segments are determined by that construction. Construction in GeoGebra is driven by the commands Point, Tangent, and Segment: Point objects set up reference and tangency-related locations (objects include f, A, g, B, h), Tangent creates the tangent line at the chosen location on the curve, and Segment draws the connecting/measure lines that link the tangent construction to the selected points. Suitable for high-school advanced learners and first-year undergraduates studying calculus, function graphs, and tangent-line interpretation.
GeoGebra Commands & Parameters
Point(f) → ATangent(A, f) → gSegment(A, B) → h
AI Drawing Prompt Reference
Draw the graph of a nonlinear function in the plane, then choose a specific point on the curve as the tangency (reference) point. At that point, construct the tangent line to the curve, emphasizing that the tangent’s slope represents the function’s local rate of change (the derivative’s geometric meaning). Finally, draw a segment connecting the chosen tangency point to another selected point to show the geometric linkage between the construction and the key location. Focus on the tangency condition and how the tangent line is determined from the chosen point.
The prompt above was compiled from the original drawing commands and is for reference only.